
Athletic vs Real Sociedad: 2-1 Derby Result Explained
Explore Athletic vs Real Sociedad with clear explanations, worked examples, source checks and practical questions for independent student learning.

Athletic Club defeated Real Sociedad 2-1 at San Mamés on 1 November 2026. Iñaki Williams put the home side ahead, Luka Sučić equalised and Álex Berenguer restored Athletic’s lead with a penalty before half-time. The completed result is distinct from the many earlier Basque derbies that appear when the same club names are searched.
This guide was checked on 2 November 2026. It uses official fixture information and dated reporting to explain the match’s scoring sequence, added-time notation and the difference between a rivalry story and a verifiable result. The classroom examples are original and are not presented as extra statistics from the game.
What was the Athletic vs Real Sociedad result?
The final home-away score was Athletic Club 2, Real Sociedad 1. Athletic’s own fixture report identifies the date and San Mamés setting, while LaLiga’s record confirms the completed score. A result card should preserve those details rather than displaying only two familiar badges and an ambiguous pair of numbers.
The order of club names matters. “Athletic won 2-1” and “Real Sociedad lost 1-2” describe the same outcome from different perspectives. A graphic that keeps the numbers but reverses the labels changes the result. Checking the meaning is more important than checking whether the colours look recognisable.
For a simple original exercise, give learners a home-away score and ask them to write two accurate sentences, one from each team’s perspective. Then ask them to include the date. This encourages clear communication and helps prevent an older derby result from being mistaken for the fixture under discussion.
How did the lead change?
The reported sequence moves from a level start to an Athletic lead, back to level and then to another Athletic lead. Williams scored the opener, Sučić the equaliser and Berenguer the later penalty. The home side’s second lead remained the decisive one in the final result.
A running-score diagram can show those changes as 0-0, 1-0, 1-1 and 2-1. Do not draw a steadily rising line as though football scores increase continuously. Goals are separate events. The time between them can contain many actions without producing a fractional change in the score.
Ask learners to identify which goal was an equaliser and which was the eventual winner. The labels describe a relationship to the score state, not a special kind of shot. A penalty can be an opener, equaliser or winner depending on the context in which it changes the result.
What does 45+2 mean?
A time displayed as 45+2 indicates first-half added time, not the second minute after the second-half restart. The first number identifies the normal half-length reference and the added number locates the event within the additional period. It should not be read as a decimal or confused with a minute label from the next half.
Berenguer’s goal is listed in first-half added time in the available match records. A compact graphic can retain that notation rather than flattening it into a label that loses the half. If another service uses a different minute convention, compare the underlying event before deciding that the records concern separate goals.
For an original worksheet, sort 44, 45+1, 45+3 and 46 with explicit half labels. Ask why a first-half 45+3 entry can precede a second-half 46 entry in the match chronology. The displayed numbers alone are not a universal clock; the period field supplies essential information.
Why is a derby more than a generic fixture label?
A derby is a rivalry context associated with particular clubs and communities. It can influence how supporters and journalists frame an event, but it does not replace the match record. A dramatic rivalry headline still needs an accurate date, score and account of the actions it describes.
For learners outside Spain, begin with the clubs and the location rather than assuming everyone already understands the term. A small map can help orient the reader without making unsupported claims about every supporter’s identity or beliefs. Clubs contain diverse participants and audiences, not a single uniform viewpoint.
An original classroom comparison might examine how two schools describe a local sports fixture. Ask which sentences identify verifiable events and which express a community’s enthusiasm. The aim is to understand perspective while avoiding stereotypes or treating supporters’ emotions as measurements of the players’ performance.
What does an equaliser change mathematically?
An equaliser removes the trailing side’s deficit at that moment. In a fictional 1-0 match, the away side’s next goal makes it 1-1, so the goal difference becomes zero. The match is level, but it is not automatically finished and neither team has thereby secured a final result.
This distinction is useful when reading live updates. A headline written after an equaliser can be historically accurate even if the final result later changes. The update needs a timestamp and match status. Removing those labels can turn a valid in-play observation into a misleading final-score claim.
For a small exercise, ask students to update a fictional score after each event. After every change, write leading, level or trailing for each team. They can see how a simple state model captures the meaning of the score without requiring an invented account of possession or tactical intent.
Is a penalty goal a different value on the scoreboard?
An in-match penalty goal adds one goal, just as another valid goal does. The method matters to the event description, but it does not add a bonus goal to the final total. It should also be kept separate from a penalty shoot-out used under the rules of a different type of contest.
For this fixture, the penalty restored Athletic’s lead before the interval. That is the relevant result context. This guide does not reconstruct the referee’s full reasoning or issue an independent ruling on the incident. A reported award and the converted goal can be described without pretending to have reviewed every camera angle.
Create two fictional event cards, one labelled open-play goal and one labelled penalty goal. Apply each to a score. Then add a separate shoot-out display and explain why it needs its own field. Clear data categories prevent a website from merging several different meanings of “penalty” into one ambiguous number.
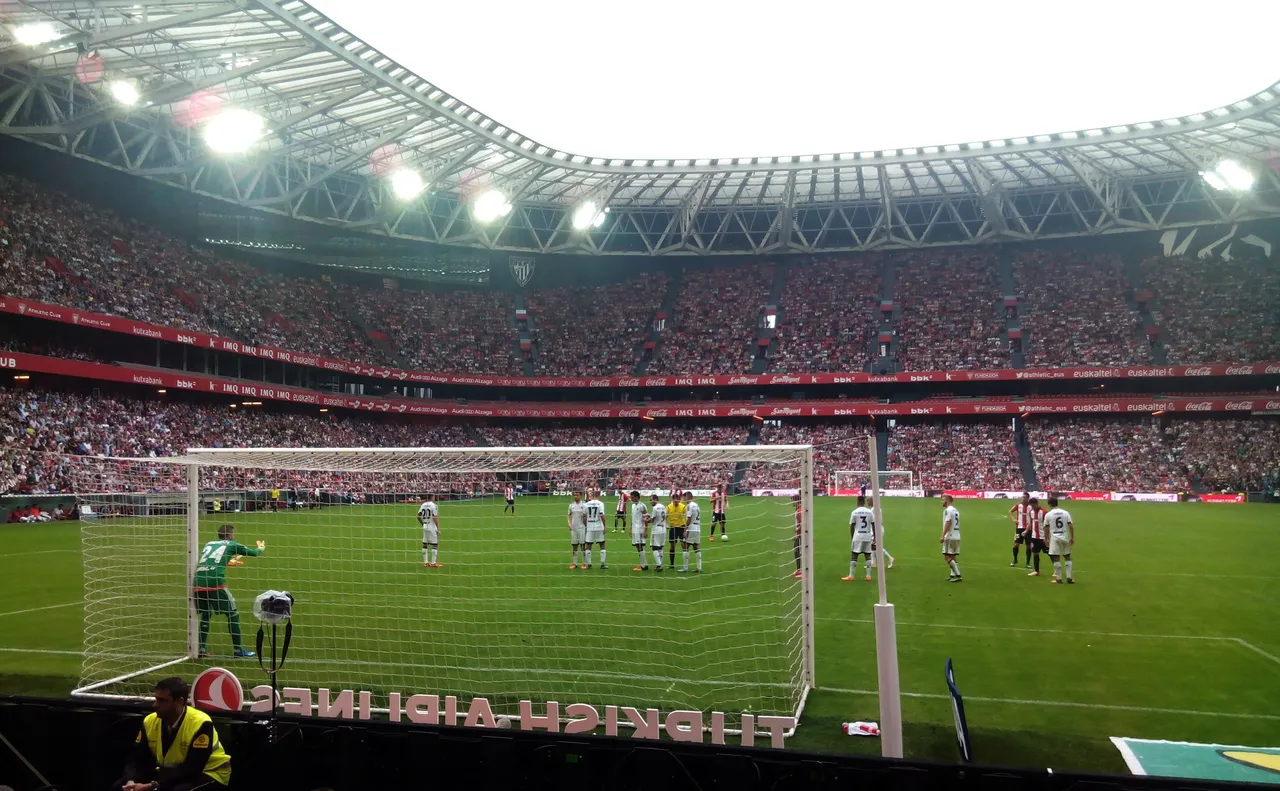
Barrera! (21352506154) (2). Historical or contextual illustration; not a photograph of the current event or product being reported.
What can a scoreless second half still contain?
The final score matched the score reached before half-time, but that does not establish that the second half contained no chances, saves or changes. It means no later valid goal altered the recorded result. A summary should not turn the absence of a goal into a detailed claim about everything that happened.
Use an invented second-half event list containing a save, a blocked shot and a substitution. The score can remain unchanged while those events affect the narrative. Ask learners which details appear in a scoreline and which need another record. Both forms of information can be useful without being interchangeable.
If you watch highlights, describe the moments shown rather than claiming a complete tactical assessment. A compilation is selected footage. It may help explain a particular action but does not provide the entire time distribution of attacks or a reliable possession figure simply through the length of its clips.
Why should derby statistics have a defined scope?
A head-to-head statistic can count league games, cup ties, home fixtures or all competitive meetings. Those are different datasets. A claim such as “unbeaten in recent derbies” needs a period and competition scope before it can be evaluated. The fixture name alone is not enough.
This article does not manufacture a historical record or infer it from a handful of search results. For a classroom exercise, create a small fictional fixture list and filter it in different ways. Count league-only results, then all supplied results. Explain why the totals differ even though the arithmetic is correct in each filtered set.
Keep the filter visible on a chart. A user should not have to guess whether a statistic includes another competition or a different venue. This is an important lesson in data presentation: a number can be accurate for one question and misleading when its label suggests a broader one.
Does this win alone establish a league position?
No. A table requires the accumulated results and the applicable ranking rules. A win changes Athletic’s points under the league system, but the final position after a round also depends on other teams. This guide does not present a guessed current table beside the match report.
Use an original three-team example to show the distinction. Give the teams different starting points and one result each. Update them in sequence, keeping the check time visible. A temporary position during the exercise may change after the next result, even when the first team’s own total remains the same.
If two teams are level, consult the supplied competition rule rather than choosing a favourite tie-break. A table is not simply a decorative ranking of whichever clubs happen to be mentioned in a headline. Its scope, rules and date need to be as clear as the score it summarises.
Build a period-aware match timeline
Use fields for period, displayed minute, event type, team and player. Keep the period separate from the text shown to the reader. This makes a first-half added-time goal easier to order correctly without pretending that the display label is an exact stopwatch measurement.
Learners can build a version in our programming courses. Start with fictional goals, then check that the verified sequence discussed here can be represented. Include an unknown-time state rather than assigning zero to a missing entry. Missing information and an event at the start of a period are not the same thing.
Test an added-time entry, an ordinary second-half minute and a corrected goal record. The display should remain in the right order after each update. These are meaningful tests because they target a real interpretation problem, not merely whether the page contains a colourful football card.
What should a stadium photograph establish?
A historical image of San Mamés can illustrate the venue without depicting this derby. A photograph of Real Sociedad’s home ground can provide club context but should not be labelled as the location of the November fixture. Captions should preserve the distinction so that the illustration does not contradict the report.
Use the image record to identify the subject and licence. Do not copy a photograph from a match report merely because it is publicly visible. A licensed contextual image with an honest caption is more useful than an unlicensed current image or a photograph attached to the wrong year.
Alternative text should describe what is visible. Avoid stuffing it with several unrelated player names or claiming an action outside the frame. Accessibility and accuracy work together when the image’s actual purpose is explained instead of hidden behind search terms.
Questions for a final check
Can you state the result in home-away order? Can you identify the equaliser and explain why the later penalty became the winning goal? Can you interpret a first-half 45+2 label without placing it after the second-half restart? These questions test understanding rather than simple recall of the headline.
Then choose one broader claim, such as a historical derby trend or a current league position, and identify the extra record it requires. The Athletic-Real Sociedad match can be enjoyed as a rivalry while still being described precisely. A clear guide keeps the verified event, the source perspective and the original learning examples distinct.
Before sharing a result card, ask another reader to reconstruct the score using only its labels. If they cannot tell which side was at home, which goal equalised or when the winner arrived, improve those labels. Good presentation should make the sequence easier to check, rather than relying on a dramatic photograph to imply an explanation.
Sources
- Athletic Club official fixture report, 1 November 2026, for the fixture, venue and result.
- LaLiga official match record, for the completed score and scoring sequence.
- EITB match report, for its dated account of the scorers and penalty. All fictional timelines and exercises are original educational work, not further match statistics.
Image credits: cover: Валерий Дед, source, CC BY 3.0. Resized and converted to WebP. inline: josu.orbe, source, CC BY-SA 2.0. Resized and converted to WebP.
Found an error or an outdated detail? Report a correction with the article URL and original source.