
Australia vs UAE: Semi-Final Scorecard and Unused Balls Explained
Read Australia’s 53-run Hong Kong Sixes semi-final win over UAE and understand 5.3 overs, unused balls and the limits of summary scorecards.
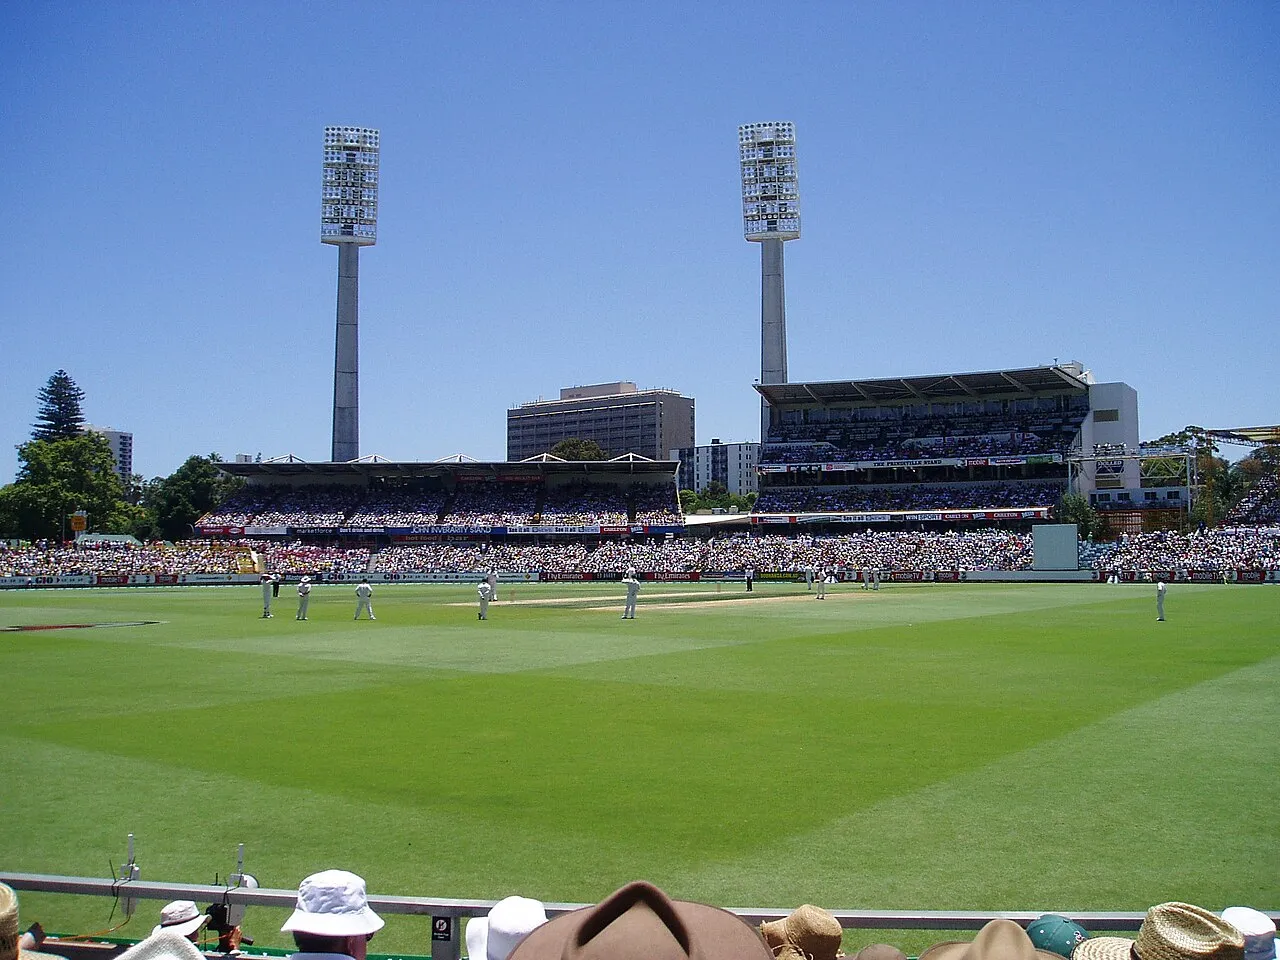
Australia beat UAE by 53 runs in the first Cup semi-final of Hong Kong Sixes 2026 on 31 October. The organiser's feed lists 141 for Australia and 88 for UAE, with the reply ending after 5.3 overs. This guide uses that record to explain a completed innings, an unused allocation and the limits of summary scorecards.
Checked on 2 November 2026, it is a recorded-match learning page rather than a live feed. The organiser's prose and structured data differ on Australia's wickets lost, so that field remains attributed rather than silently reconciled. Historical illustrations are not claimed to show the semi-final, its individual deliveries or a later trophy presentation.
What was the Australia versus UAE result?
The organiser declares Australia the winner by 53 runs, with Australia scoring 141 and UAE 88. The totals reconcile with the margin: 141 minus 88 equals 53. The stage was the Cup division's first semi-final, so the result advanced Australia to the championship match rather than awarding the title itself.
The country names are not enough to identify this fixture. Australia and UAE can meet in other formats and editions, so the competition, date and stage should stay visible. A result card stripped of those labels can be mistaken for a different national-team encounter even when the numbers were copied accurately.
Read the innings order before interpreting the margin. Australia batted first and UAE replied in the listed record. A run-margin win describes the defending side finishing with more runs than the completed chase. It is not the same as a chasing side winning by a declared wicket margin.
For a beginner's card, use full labels for innings total, wickets and legal balls. Then add the declared result as a separate sentence. That makes the record understandable before a reader learns the compressed display style of a particular sports website. Good labels are an accessibility feature, not merely decoration.
Why does the Australia wicket count need a note?
The organiser's structured feed lists Australia at 141/2, while its semi-final prose says 141/3. Both give the same run total and winning margin. This guide does not claim to have independently settled the differing wicket count from a definitive ball-by-ball scorecard.
It is useful to handle a conflict at the field where it occurs. You can report the supported 53-run win while identifying Australia's wickets as an attributed detail. Replacing the whole record with a vague warning would hide what is clear; choosing a number without explanation would hide what is not.
For a data exercise, store value, source and check date together. If two sources disagree, retain both observations in your research notes while displaying a clearly attributed field. Do not average wicket counts or convert the disagreement into a made-up decimal. Some data cannot sensibly be reconciled by arithmetic.
The method generalises beyond sport. A school attendance record, an event programme or a financial table can contain one disputed field while other fields are consistent. Good review asks exactly which claim differs and what evidence could resolve it, rather than treating every uncertainty as either total failure or permission to guess.
How many legal deliveries is 5.3 overs?
With six balls per over, 5.3 means five completed overs and three additional legal balls: thirty-three legal deliveries. It is not the decimal number 5.3 overs. The feed explicitly provides thirty-three balls for UAE, which supports the conversion without reconstructing any unprovided delivery sequence.
Draw six rows of six boxes for a fictional six-over allocation. Fill five rows and three boxes in the last. Three boxes remain unused. The drawing makes the relationship between notation and legal balls visible, especially for a learner who is used to interpreting a point as a decimal separator.
Now compare 5.3 and 5.5. They differ by two legal deliveries, not 0.2 of an ordinary decimal over. If you first convert each to balls, thirty-three and thirty-five, the distinction is clear. You can derive a decimal number of six-ball overs afterwards when a rate calculation needs one.
Keep legal deliveries separate from all recorded events. Wides, no-balls and other scorekeeping actions can make a feed contain more rows than the legal-ball count. A beginner model should state which events consume a box rather than assume that every row advances the over clock.
What does an innings ending before six overs mean?
The listed reply ends at thirty-three legal balls rather than thirty-six and records six wickets lost. That describes the recorded innings endpoint in this event. The unused three-ball allocation should not be mistaken for another scheduled mini-innings that must be added later to complete the score.
An allocation is the maximum opportunity under the relevant conditions, not a guarantee that every legal delivery will be used. A successful chase can finish early too. To understand why a particular innings ended, combine the score, result and playing conditions rather than relying on the over count alone.
For a fictional exercise, make three endpoints: target reached, allowed innings completed and no further batting available under the model's rules. All can end an innings, but they describe different situations. A clear interface should not label every early endpoint as rain or every completed allocation as a failed chase.
This guide does not import an eleven-player wicket formula into six-a-side cricket. The organiser's result and event-specific record supply the outcome. If you want to model the competition fully, read its playing conditions. A simplified demonstration can be useful without pretending to reproduce every participation rule.
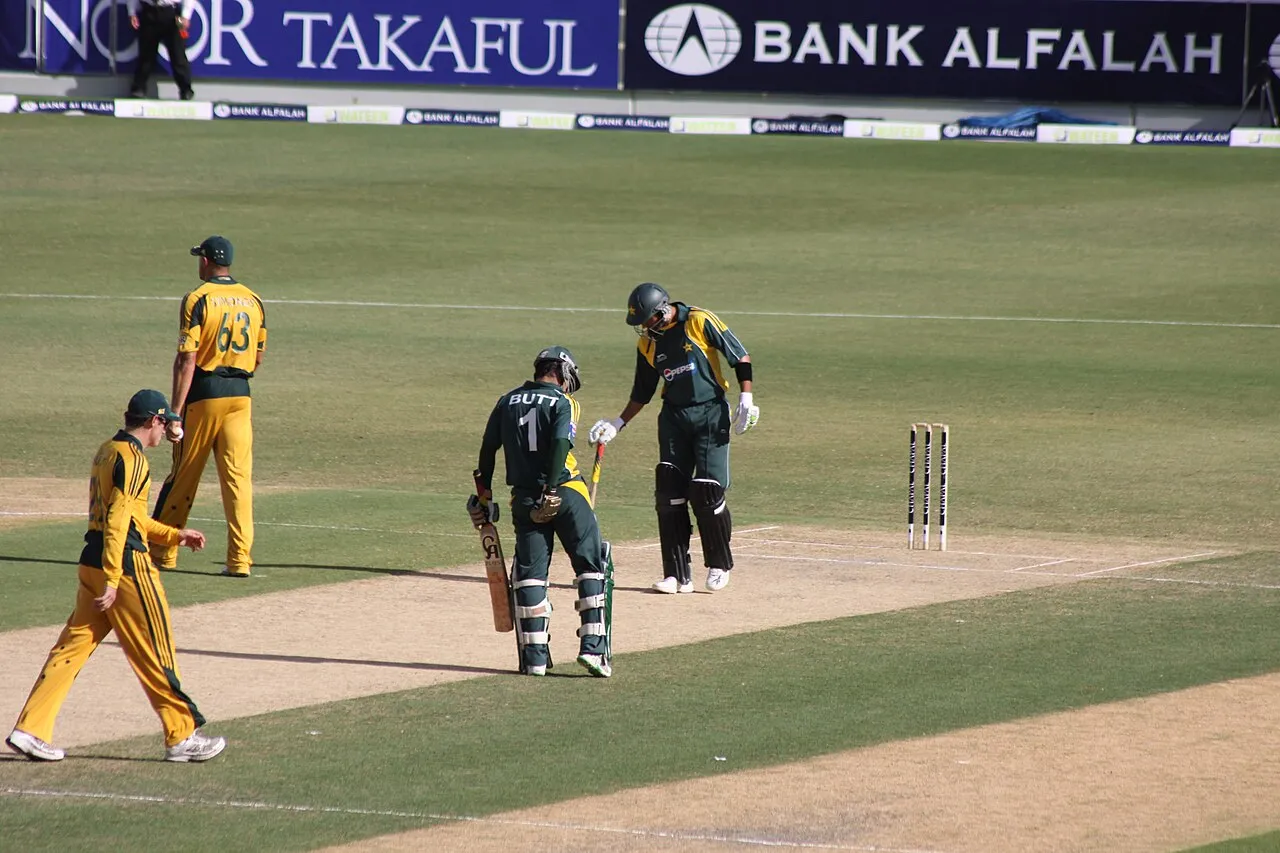
A different historical Pakistan-Australia fixture in Dubai; not the Australia-UAE semi-final.
Can unused balls be converted into hypothetical runs?
Not as a statement of what actually happened. You may explore a labelled scenario about what could have been scored, but the completed result contains only recorded runs. Multiplying unused balls by a convenient average does not create an alternative official total or prove the losing side would have caught the target.
For an original example, imagine a side ends with three balls unused and an earlier average of two runs per ball. Adding six hypothetical runs is one scenario, not a prediction guaranteed by that average. The next deliveries could have produced several outcomes, and the reason the innings ended may mean those balls were never available to play.
This is the difference between description and a counterfactual model. The description records the event; the model asks what might happen under changed assumptions. Label the assumptions before presenting a graph. Otherwise, an attractive projection can be mistaken for runs that a team was somehow owed.
A useful classroom question is whether the scenario changes the rules as well as the score. If the model lets an already-ended innings continue, it is no longer simply forecasting the same state. Making that change explicit helps learners recognise how a small-looking assumption can alter the entire question.
What do the reported Australian contributions show?
The organiser's prose highlights Max Bryant's 60 from fifteen balls and Nick Hobson's 53 from eleven. Those are selected batting contributions in the reported innings, not a complete account of every run or dismissal. They help identify the scoring involvement without proving the outcome of every delivery.
A highlighted pair can contribute a large share of a total while other batters and extras still matter. Do not assume the two figures must add exactly to 141. A score summary and a full scorecard have different levels of detail. Use the full accounting when your question requires every contribution.
For a fictional example, two highlighted batters make forty and thirty in a total of ninety. The remaining twenty may come from other contributions and extras, but the summary alone does not tell you their distribution. Leaving that distribution unknown is more accurate than inventing a third score to make a neat chart.
The same caution applies to partnerships. Two players' innings totals are not automatically the runs they scored together at the crease. A partnership covers a particular period of joint batting. You need the appropriate sequence or partnership record before turning two individual scores into a partnership figure.
How should an innings rate be used?
A simple recorded scoring rate describes runs relative to the relevant played allocation. A competition's net-run-rate calculation can use special treatment for completed or all-out innings, so it should not be reconstructed from a casual division without checking the rules. These are different calculations, even when both contain the words run rate.
Start with a fictional six-over innings of ninety: fifteen per over. Then give another invented side ninety from five overs: eighteen per played over. The equal totals and different pace tell you something about those examples, but they do not settle which side would rank above another in a tournament table.
Ranking can depend on wins, points and declared tie-breaks as well as the treatment of particular innings. An educational rate exercise should state its purpose. Do not title a simple comparison “official net run rate” unless it genuinely applies the competition's complete calculation to the relevant dataset.
Our Netherlands–UAE standings guide discusses why a table needs its own source and date. Although that is another competition, the boundary transfers: one match's totals do not provide every input needed to reconstruct a campaign-wide ranking.
Where did the semi-final lead?
The official bracket sent Australia to the Cup final and UAE to the third-place playoff. A later loss or win in those fixtures would not rewrite this semi-final. Each stage has its own result, and a complete archive should preserve the route rather than replacing every earlier entry with the final placing.
For a small bracket project, store each fixture as an event and qualification as a link to another event. This avoids a common design problem where “finalist” is treated as the result of every match the team played. The semi-final result explains the qualification; the final result answers who won the championship.
The Hong Kong Sixes final explainer covers the separate title match. A reader looking for Australia versus UAE should not be shown the Australia versus Afghanistan score simply because both fixtures belong to the Cup route. Opponent and stage remain essential identifiers.
The same principle applies to historical images. A photograph of an Australian player at another event can provide identity context, but it is not evidence of this semi-final. Captions should say what the image establishes and avoid turning a familiar kit into a claim about the photographed fixture.
Build a careful completed-match display
Show the winner, stage and confirmed run totals first. Keep an attribution note on the disputed wicket field. Convert the legal balls correctly, and distinguish the innings endpoint from the maximum allocation. A small display that preserves these meanings is more useful than a larger one filled with unsupported over-by-over bars.
Test it with a fictional early successful chase and an innings ending before its allocation for another reason. The interface should not confuse the two states. It should also preserve missing fields as unknown rather than converting them into zero. Those are meaningful tests of the model's understanding of the sport.
You can build this as a project in our programming courses. Begin with invented data and explain each rule in plain language. Only label a page as a live or official scorecard when it actually has the appropriate source and update process. A clear teaching demonstration does not need to impersonate either.
Before sharing, ask whether every chart value exists in the source or comes from a labelled exercise. A final total can support a simple comparison without supplying an over-by-over history. If a value was imagined to make a display more interesting, keep it in the practice model. That boundary lets a learner experiment freely while protecting the completed match record from invented detail.
Sources
- Official result feed, record 5525, for attributed innings fields and the declared 53-run result.
- Organiser's semi-final account, for selected batting contributions and the differing Australia wicket count.
- Official progression archive, for the later routes. Counterfactual runs, rate examples and classroom models are fictional learning activities.
Image credits: cover: The original uploader was Edelmand at English Wikipedia., source, Public domain. Resized and converted to WebP. inline: https://www.flickr.com/photos/bilalmirza, source, CC BY 2.0. Resized and converted to WebP.
Found an error or an outdated detail? Report a correction with the article URL and original source.