
Delhi-NCR AQI Explained: Delhi, Noida and Gurugram Data Checks
Read official Delhi, Noida and Gurugram AQI data, compare station timestamps and scales, and distinguish health guidance from restriction orders.
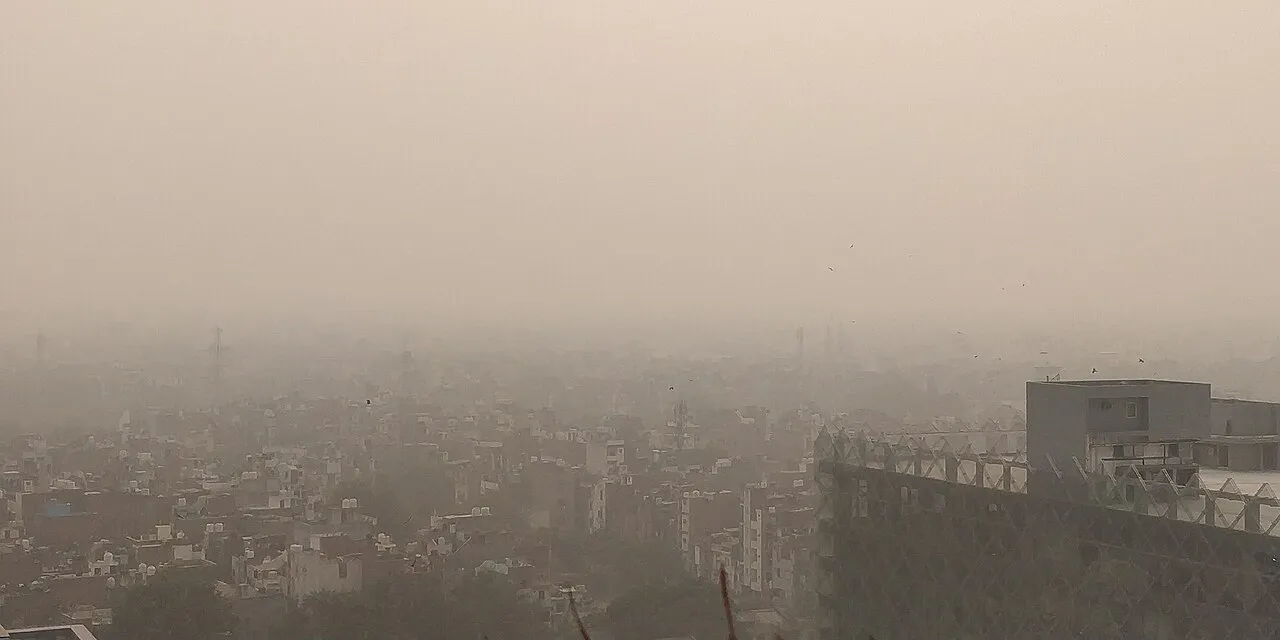
Delhi-NCR air quality should be checked using a named monitoring location, a recent timestamp and the correct AQI scale. A number without those details can be misleading. Delhi, Noida and Gurugram are related parts of a region, but a reading for one station does not describe every street, school or journey across that region.
This guide was checked on 5 November 2026. It explains how to read official air-quality information and distinguish measurements, health guidance and government orders. It does not publish a live AQI value, predict tomorrow's pollution or announce a school closure. Use the current official dashboards and notices for decisions requiring up-to-date information.
Where should I check Delhi and NCR air quality?
For Delhi, start with the Government of NCT of Delhi air-quality portal. For locations elsewhere in NCR, use the relevant city or monitoring station on the official CPCB dashboard. Confirm that the selected place matches your enquiry before interpreting the number, particularly when moving between Delhi, Noida and Gurugram.
Save the official page as a bookmark rather than searching for a new screenshot every morning. A bookmark keeps the route consistent while allowing the displayed data to change. A forwarded image preserves only the moment when someone captured it, which may be unrelated to the moment when you read it.
Write down what you actually need to know. Are you checking the area around a school, comparing a journey's endpoints or examining a regional pattern for an assignment? These are different questions. Choosing a measurement after defining the question is more useful than selecting whichever number looks most dramatic.
What do India's AQI categories mean?
India's National AQI categories are Good, 0-50; Satisfactory, 51-100; Moderate, 101-200; Poor, 201-300; Very Poor, 301-400; and Severe, 401-500. These categories communicate the interpretation of the index. Use the guidance belonging to India's scale rather than attaching advice taken from an unrelated app's colour scheme.
| Indian AQI range | Category |
|---|---|
| 0-50 | Good |
| 51-100 | Satisfactory |
| 101-200 | Moderate |
| 201-300 | Poor |
| 301-400 | Very Poor |
| 401-500 | Severe |
A category is a summary, so retain the accompanying number and context when taking notes. If two readings belong to the same category, they need not be identical. Conversely, moving across a category boundary is not evidence that every person's exposure changed suddenly by the same amount at that instant.
Why can two apps show different numbers?
Check whether the services use India's AQI or another system such as the US AQI. Different scales use different breakpoints, so the same number on two scales does not necessarily carry the same meaning. Also compare the location and timestamp before deciding that one service must be wrong.
Imagine two classmates comparing screenshots. One selected a city summary at noon, while the other selected a particular station an hour earlier. Their screenshots are not a controlled comparison. First align the question, location, time and scale; only then investigate whether a remaining difference needs an explanation.
Keep a short comparison checklist beside your notes: source, scale, place, observation time and whether the value is measured or forecast. This turns an argument about which app looks more authoritative into a question about whether the underlying information is comparable. Visual polish alone cannot answer that question.
How is a station reading different from a city summary?
The Delhi portal explains that a station's index uses the highest available pollutant sub-index under the prescribed data requirements. Its Delhi summary averages stations reporting for the relevant hour. These are different summaries. A city value can therefore coexist with higher and lower readings at individual monitoring locations.
For a local enquiry, identify a relevant reporting station and read its details. For a broader overview, examine the city summary and the spread of station readings. Do not silently switch between these two views when presenting a comparison. Label the level of the observation in every chart or caption.
Consider a hypothetical classroom dataset containing three invented station values. The middle value, the highest value and the average answer different questions. Before calculating anything, write the question that your chosen summary answers. This exercise teaches why a single regional headline cannot convey the full pattern within a monitoring network.
What timestamp should I record?
The Delhi portal distinguishes the hour represented by a reading from the time its website last checked the feed. It marks delayed data separately and describes real-time figures as provisional. Record the observation time alongside the value. A recently refreshed webpage does not automatically mean that every station supplied a new measurement.
Use a simple notation such as source, location, observation date and observation time in IST. If the page displays a delay warning, copy that warning too. Leaving it out can make a stale value look current when a classmate or family member reads your notes later.
When sharing a screenshot, include the time and location visibly or explain them in the accompanying text. Avoid cropping away the very details needed to interpret the number. An image may look cleaner without its surrounding labels, but it becomes less useful as evidence of what was measured.
What are PM2.5, PM10 and a pollutant sub-index?
PM2.5 and PM10 refer to particulate-matter size categories. Official AQI information also considers other pollutants. An AQI value is an index, not a direct substitute for every pollutant concentration. Read the pollutant label and units on a chart before treating a concentration as though it were an AQI reading.
For a learning exercise, make two columns titled measurement and interpretation. Put a reported concentration and its unit in the first column. Put the index category and its stated scale in the second. Keeping these columns separate prevents an easy mistake: copying a familiar-looking number into the wrong type of statement.
Ask a second question whenever you see a chart: what does each axis represent? A curve may describe hourly variation, a concentration or an index. If the label is unclear, do not guess. An honest note that the chart could not be interpreted is better than a precise-looking but unsupported explanation.
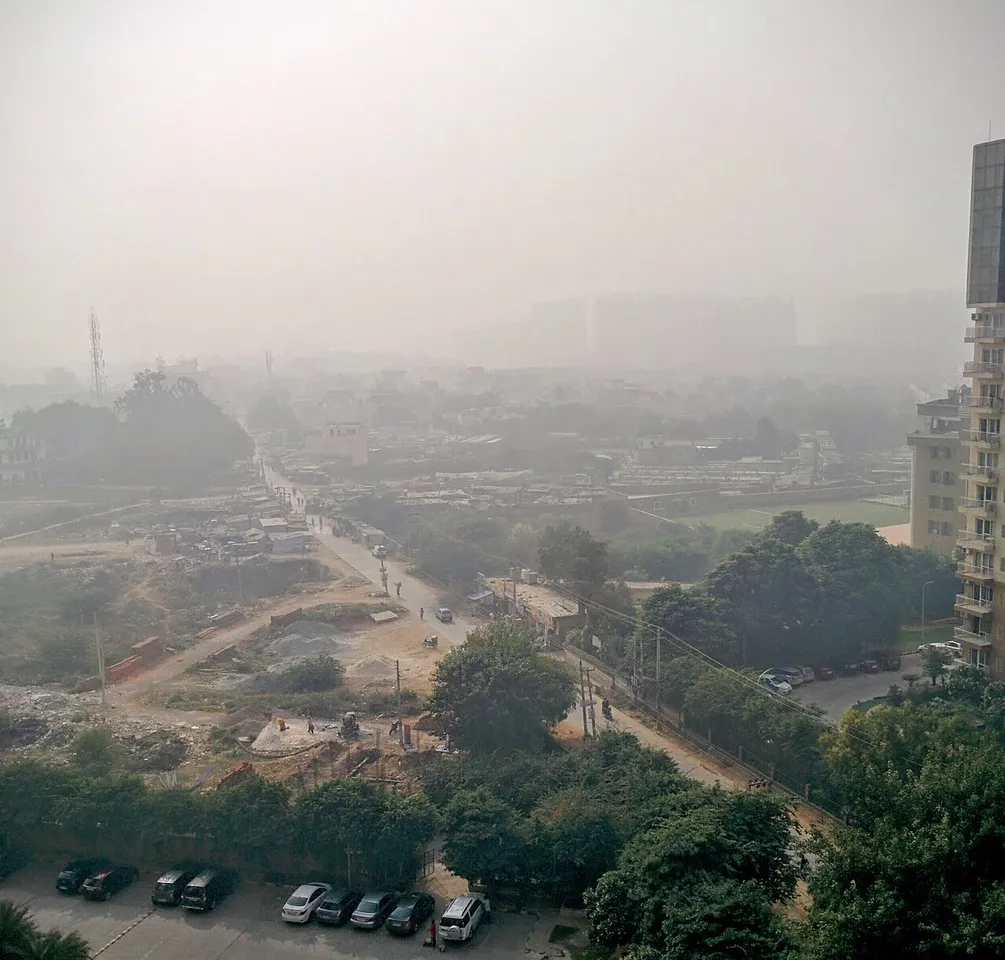
Historical smog near Gurgaon in November 2016, used for regional context rather than evidence of current Gurugram air quality.
Does a high AQI automatically announce restrictions?
Air-quality information and official restrictions are separate records. The Commission for Air Quality Management issues GRAP-related orders, while the applicable notice sets out its scope and effective arrangements. A social-media post naming a pollution category is not itself an order closing schools, changing office attendance or restricting a particular activity.
For any claimed restriction, find the issuing authority, order date, effective period and affected area. Read what the order actually requires. A headline may summarise a longer notice, and that summary can omit exceptions or operational details that matter to the person trying to follow it.
Keep a measurement log separate from an order log. In the measurement log, record locations, readings and times. In the order log, record the official notice and its stated effect. This separation makes it easier to explain both what the air-quality information shows and what a responsible authority has directed.
How should families use official health guidance?
The Government of India's air-pollution advisory gives different activity guidance for the general population and vulnerable groups. It identifies children, older people, pregnant women and people with certain existing conditions among those needing particular care. At worsening categories, its recommendations include reducing or avoiding outdoor physical exertion according to the applicable guidance.
Use that official category-specific advice rather than treating a news article as personalised medical advice. If someone has an existing care plan, questions about changing treatment belong with their clinician. An index and a general guide cannot assess an individual's symptoms, exposure history or medical needs.
Discuss practical arrangements calmly. Families can agree who checks official updates and how they will communicate any changes in plans. A shared process avoids repeatedly forwarding alarming messages without checking their date or source. The purpose is to understand relevant guidance, not to turn each change in a dashboard into a new rumour.
How can students compare Delhi, Noida and Gurugram fairly?
Choose a consistent observation time and define one comparable measure for each location. Do not compare a Delhi city summary with a single Noida station while presenting both as identical citywide measurements. If comparable information is unavailable, describe the limitation instead of filling the gap with an assumption.
Create a worksheet with location, source, measurement type, timestamp, scale and any data warning. Add values only after completing those labels. This order encourages good recordkeeping because the number no longer appears as an isolated fact that can be copied without context.
When presenting the worksheet, distinguish observation from explanation. You can report that two recorded values differ. Explaining why they differ requires additional evidence. Avoid naming a single cause merely because it is frequently mentioned online. A comparison can be informative without pretending to prove a complete account of regional pollution.
What should an air-quality classroom project include?
Start with a narrow question, such as how a named station's reported index changed over several comparable observation times. Define your method before collecting values. Then record every observation, including missing or delayed data. Removing inconvenient gaps without explanation makes a tidy chart less trustworthy.
Choose readable labels and an appropriate scale for the chart. Mark the dates and times clearly. If you add category bands, identify them as India's National AQI categories. Give the data source beneath the chart so another student can understand where the observations came from and what they represent.
End with a short account of limitations. Your chosen station may not describe a person's entire day. A small set of observations may not represent every season or location. Explaining these limits demonstrates good analysis; it does not make the project weaker. It shows that your conclusions fit the evidence you collected.
How do I recognise an unreliable pollution update?
Be cautious when an update gives a dramatic number but no station, scale or observation time. Check whether its image is historical and whether its caption describes the same place as its headline. An old photograph can illustrate a topic, but it cannot establish today's reading or a newly issued restriction.
Other warning signs include a forwarded notice with no issuing authority, a closure claim linked only to a general homepage and a chart whose labels have been cropped away. These are reasons to verify the claim, not reasons to invent the missing detail yourself.
Before sharing, try rewriting the update as a complete factual sentence. Include who reported what, for which place and when. If those details are unavailable, say that you could not verify the update and link to the current official source instead of repeating it as established news.
Frequently asked questions
What is Delhi's AQI right now?
Use the current official dashboard. This educational article deliberately does not freeze a changing reading into its opening paragraph. When you check the dashboard, record the observation time, the location and the scale. Those details are necessary before comparing the value with another source or an older screenshot.
Can I use one NCR reading for every location?
A regional label does not remove the importance of the selected monitoring location. Decide whether your enquiry concerns a city summary, a particular station or a route between places. Use information at that level and explain its limits. Do not relabel one local observation as a measurement of the entire region.
Does a photograph prove the AQI category?
No. A photograph records an appearance from a particular viewpoint and moment. It cannot replace the monitoring data, units and calculation method behind an AQI report. Historical images in this guide are labelled as illustrations and should not be interpreted as evidence of conditions on 5 November 2026.
Where can I practise the data skills used here?
The class resource directory and programming courses contain available learning material for further study. You can practise organising a table, checking units and explaining a graph using a small invented dataset before working with official environmental observations. Keep invented examples clearly labelled so nobody mistakes them for current readings.
Sources
- Delhi Department of Environment: AQI methodology and timestamps
- CPCB information on the National Air Quality Index
- Government of India advisory on air pollution and health
- Commission for Air Quality Management: official notices and orders
Image credits: cover: Prami.ap90, source, CC BY-SA 4.0. Resized and converted to WebP. inline: Saurabh Kumar, source, CC BY-SA 4.0. Resized and converted to WebP.
Found an error or an outdated detail? Report a correction with the article URL and original source.