
Groundwater Explained: Aquifers, Recharge and Water Tables
Explore Groundwater Explained with clear explanations, worked examples, source checks and practical questions for independent student learning.
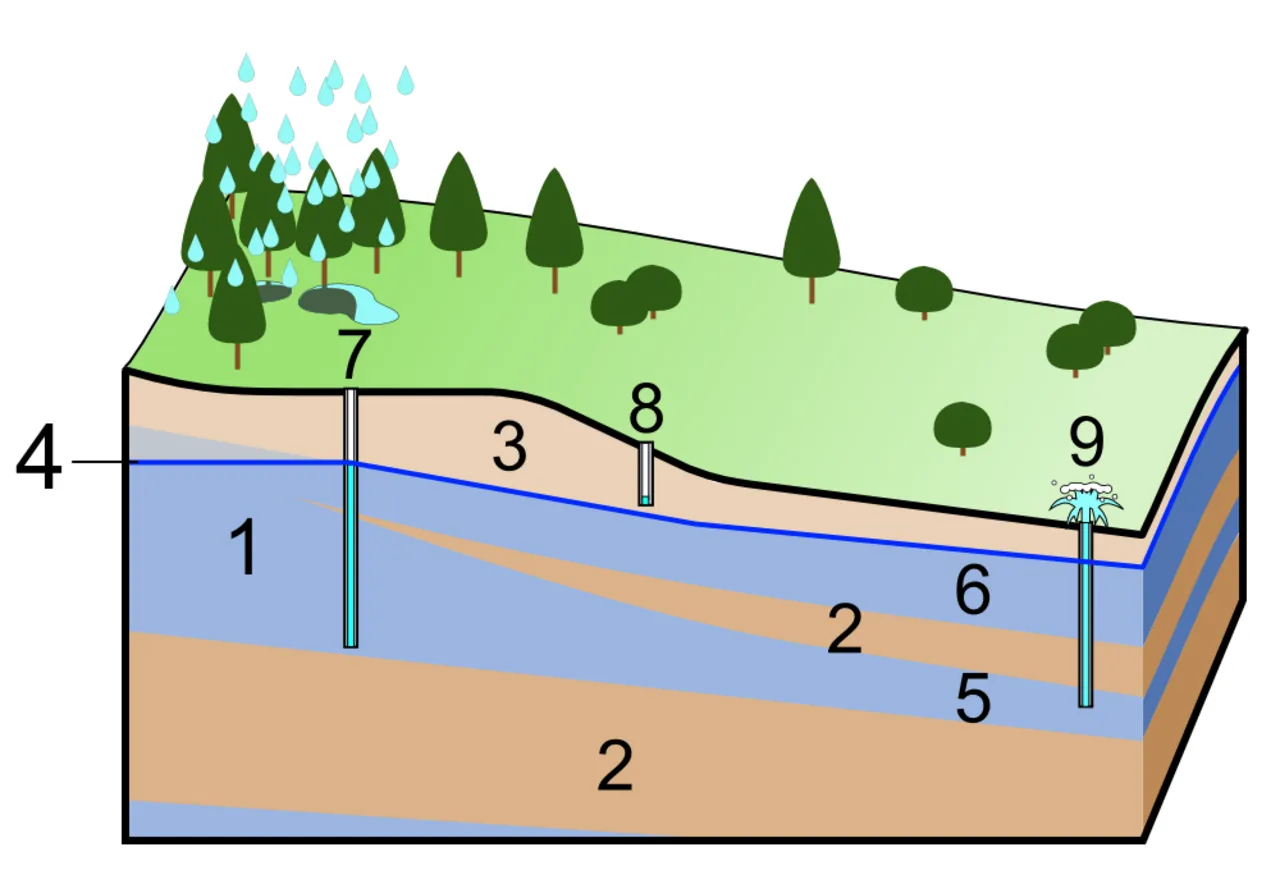
Groundwater is water stored beneath the land surface in the pores and fractures of soil and rock. It is not usually a hidden underground river. An aquifer is a geologic unit that can store and transmit usable groundwater, while the water table marks the top of the saturated zone in an unconfined system. These distinctions make wells, recharge and water-level reports easier to understand.
This guide was checked on 2 November 2026 using public geological education sources. It uses original drawing exercises and classroom calculations rather than claiming a current measurement for a particular Pakistani city. It does not provide drilling instructions, predict a local well’s yield or determine drinking-water safety from appearance.
Where is groundwater stored?
The US Geological Survey explains groundwater in terms of water occupying spaces between particles and fractures in rock below the water table. The important image is a material containing connected spaces, not a universal underground lake. Some geological settings include larger openings, but they should not become the assumed model for every aquifer.
For a simple classroom demonstration, place clean gravel in a clear, unbreakable container and add water slowly. Observe the spaces that become filled. This is a visual model of storage between solid pieces, not a reproduction of all natural groundwater conditions. Keep it as a supervised observation activity and do not drink the demonstration water.
Ask learners why the container still contains gravel after water is added. The water occupies available spaces rather than replacing the solid material. The exercise helps explain why a large underground water store does not mean the ground must be an empty cavern.
What is the difference between porosity and permeability?
Porosity concerns the proportion of space within a material. Permeability concerns how readily fluid can move through connected pathways. A material can have spaces that do not connect well enough to transmit water easily. The two ideas are related, but they should not be used as interchangeable labels.
The Utah Geological Survey explains a useful aquifer through both storage and flow. For an original drawing exercise, make two fictional materials with the same number of spaces, but connect the spaces in only one. Ask which drawing offers a continuous route. The diagram illustrates connectivity without measuring a real material’s properties.
Do not infer a well’s practical yield from a classroom jar or a photograph of rock. Real assessments require site information and appropriate methods. The educational task is to understand why both the amount of space and the connections among spaces matter.
What is the water table?
In an unconfined aquifer, the water table is the upper boundary of the saturated zone. It can rise or fall as conditions change. It is not necessarily flat, and its depth below the ground can vary from one location to another. A measurement needs a location, reference point and date.
Draw a land surface and a separate water-table line beneath it. Make both vary across the page. Ask learners to distinguish the vertical distance below the ground from the elevation of the water surface. These are different quantities, and confusing them can lead to a wrong comparison between two wells.
An original example might show water five metres below a high site and three metres below a lower site. The shallower depth does not automatically mean the second water surface has the higher elevation. The land-surface reference must also be known before making that comparison.
How do depth and elevation differ?
Use a shared imaginary elevation reference. If a site is at 105 metres and its water level is five metres below the reference point used in the exercise, the water-level elevation is 100 metres. At a site with a 100-metre reference and water three metres below it, the corresponding elevation is 97 metres.
These are fictional values designed to show subtraction and reference systems. They are not measurements from a named city. A real survey must use the correct reference point and account for how the well measurement was taken. A ground-level assumption should not silently replace a different surveyed reference.
This distinction matters in maps and databases. Store the depth and reference elevation separately, with their units. A field called only “water level” can be ambiguous. A reader needs to know whether the number means depth below a point or elevation above a shared datum.
What is groundwater recharge?
Recharge is water entering the groundwater system. Rainfall can contribute, but not every drop of rain becomes groundwater: water can run off, evaporate or remain in other parts of the system. A rainfall total alone is therefore not a direct measurement of aquifer recharge.
For a conceptual classroom budget, divide an invented 100 units of incoming water among runoff, evaporation and infiltration. Label the values as assumed. Then discuss why infiltration near the surface and eventual recharge to a deeper system should not automatically be treated as the same measured quantity.
The point is not to calculate a real recharge rate from a simple worksheet. It is to identify the pathways and missing information. A useful water-balance diagram shows where an assumption enters rather than presenting every arrow as a verified local measurement.
How are groundwater and rivers connected?
Groundwater can discharge to a stream in some settings, while a stream can lose water to the groundwater system in others. The relationship depends on water levels and the connection through the materials involved. A river and an aquifer should not always be pictured as separate containers with no exchange.
The Utah Geological Survey describes gaining and losing stream relationships. For an original diagram, show one fictional stream with surrounding groundwater higher and another with the opposite relationship. Explain that the diagrams illustrate possible conditions, not a permanent label for every river segment.
Ask what might change over time. Seasonal conditions, pumping or stream levels can alter the relationship. A dated observation is more informative than a claim that one site must always behave the same way. The connected-system idea helps explain why groundwater questions can also matter to surface-water management.
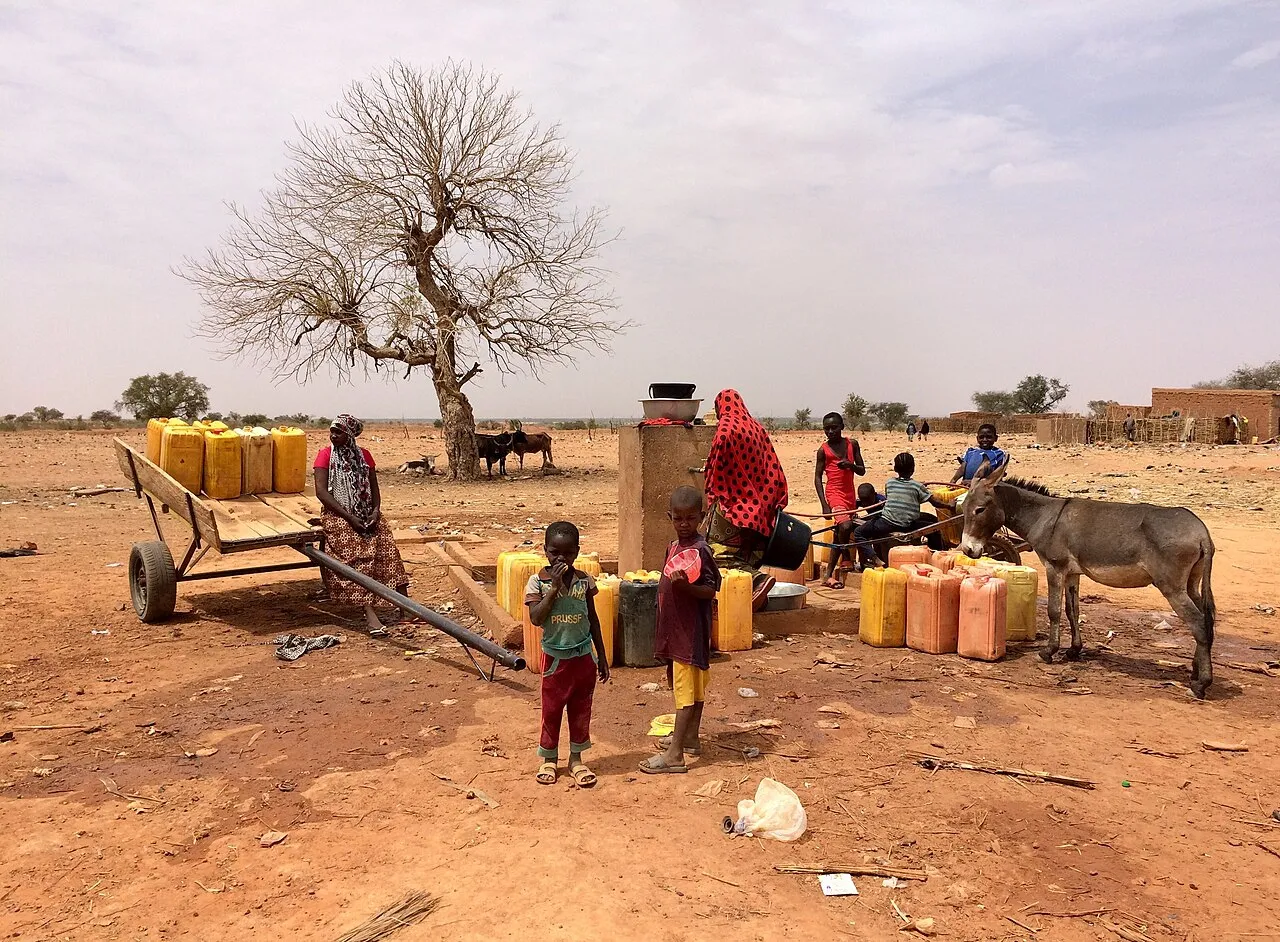
A well photographed in Margou, Niger. It does not establish local water quality or groundwater conditions in Pakistan.
What happens when groundwater is pumped?
Pumping removes water from the system and can lower the water level around a well. The response depends on the aquifer and pumping conditions. This guide does not estimate a real drawdown or specify how deep a well should be drilled. Those are site-specific technical questions.
Use an original inventory exercise with 1,000 fictional units entering storage and 1,200 leaving over the same period. The simplified balance is a reduction of 200 units if those are the only flows. The calculation does not directly give a water-level fall in metres, because translating storage change into level change requires additional properties and geometry.
That limit is important. A correct subtraction can still be given the wrong unit. If the inputs are volumes, the immediate result is a volume difference, not a depth. A well-designed worksheet or calculator should make the unit of every input and output visible.
Does a deeper water measurement always mean the aquifer is empty?
No. A change in measured depth describes the water level relative to the stated reference. It does not, by itself, establish that the entire aquifer is empty or quantify all remaining usable water. The interpretation needs the geological setting, measurement conditions and a suitable time series.
For a fictional record, compare depths of seven and nine metres below the same reference point. The second water level is two metres lower. That is the supported change. It does not tell you the total volume removed or prove that every nearby well experienced the same response.
Avoid turning one measurement into a dramatic regional conclusion. A local observation can be valuable while still having a limited scope. Good reporting explains what was measured, where and when, and which broader questions need further evidence.
What is the difference between confined and unconfined groundwater?
An unconfined aquifer has a water table associated with atmospheric pressure at its upper saturated boundary. A confined aquifer is bounded by less permeable material and can have water under pressure. Water in a well can therefore behave differently from the simple image of a hole reaching a shallow water table.
The USGS provides a separate explanation of these categories. This article uses them as introductory concepts, not a complete description of a particular local formation. A well log, geological interpretation and measurement record are needed before assigning a real site to a simplified classroom model.
For a drawing task, label the confining layer, aquifer and well separately. Ask learners which lines represent geology and which represent measured or conceptual water levels. A diagram becomes more useful when its symbols are explained rather than left to look scientific without a clear meaning.
How should a groundwater trend be graphed?
Begin with consistent units, a stable reference and dates. Decide whether the vertical axis shows depth below a point or water-level elevation. If depth increases downward in the physical setting but the graph’s values increase upward, explain the convention so that a larger number is not automatically read as more available water.
Use an original monthly dataset with a seasonal rise and fall. Ask students to describe the pattern before assigning a cause. A graph can show change without proving why it happened. Rain, pumping and other conditions need their own evidence before a causal explanation is established.
Mark missing observations rather than replacing them with zero. A zero depth is a meaningful value, while a missing measurement means no value was recorded. Connecting those states incorrectly can create a dramatic artificial jump that the real observations do not contain.
Does clear-looking water establish drinking-water safety?
No. Appearance alone does not establish whether water is suitable to drink. A groundwater source can require appropriate water-quality testing and interpretation. This article does not provide a diagnosis, a treatment method or a guarantee about a particular well based on a photograph or a simple classroom demonstration.
Keep quantity and quality as separate questions. A well may contain water without the available record establishing its intended use. Likewise, a water-level graph does not supply a chemical or microbiological analysis. A useful research notebook should identify which kind of measurement each document contains.
For an original source-sorting exercise, give learners a fictional depth record, a laboratory report heading and a rainfall chart. Ask which question each can help answer. The exercise teaches the limits of evidence without asking students to test unknown water or make health decisions from incomplete information.
Build a groundwater-data notebook
Use fields for location identifier, date, reference point, measurement type, unit, value and source. Include a separate field for uncertainty or missing information. Do not publish private property details or imply that a student project is an official monitoring service.
Learners can build a small version through our programming courses. Start with fictional wells and test the depth-to-elevation calculation using a supplied reference. The interface should refuse to compare incompatible units or silently treat missing reference information as zero.
Add a chart only after the records are clearly labelled. Test an edited reference elevation and a missing month. These cases matter because a visual can look smooth while describing the wrong physical quantity. Clear data structures support both good programming and good scientific interpretation.
Why do local groundwater claims need local evidence?
General hydrology explains possible processes, but a statement about a particular city needs appropriate local observations. This guide does not attach an unverified depletion percentage, deadline or water-table depth to Pakistan. A broad search trend is not a monitoring dataset.
When reading a local report, ask which wells were measured, over what period, with what reference and by which organisation. Check whether the conclusion concerns one site or a larger region. A map can help, but it should not hide gaps in the underlying observations.
Groundwater becomes easier to understand when storage, flow, level, volume and quality remain distinct. The same habits that improve a classroom diagram also improve the reading of public reports: label units, preserve dates, show assumptions and avoid claiming more than the available evidence can establish.
Sources
- USGS: What is groundwater?, for the introductory storage and water-cycle explanation.
- USGS: Aquifers and groundwater, for aquifer and water-table concepts.
- Utah Geological Survey: Groundwater and aquifers, for porosity, permeability and stream connections.
- USGS: Confined and unconfined aquifers, for the category distinction. All measurements, water budgets and demonstration records above are invented educational examples, not a local survey, drilling recommendation or water-safety determination.
Image credits: cover: Shigeru23, source, CC BY-SA 3.0. Resized and converted to WebP. inline: NigerTZai, source, CC BY-SA 4.0. Resized and converted to WebP.
Found an error or an outdated detail? Report a correction with the article URL and original source.