
Ishan Kishan: The 210 Innings and Batting Statistics Guide
Explore Ishan Kishan with clear explanations, worked examples, source checks and practical questions for independent student learning.

Ishan Kishan is an India wicketkeeper-batter, and his 210 from 131 balls against Bangladesh on 10 December 2022 is a useful innings for understanding cricket statistics. The historical record distinguishes his final score from the earlier double-century milestone. Reaching two hundred and finishing on two hundred and ten describe different points in the same innings, with different ball counts.
This guide was checked on 2 November 2026 using official cricket and record sources. It is not a live selection update or a current career-total page. Original exercises are marked as fictional, while calculations based on the documented innings are identified explicitly so readers can follow the arithmetic without mistaking an example for another match.
What does the historical innings record say?
The ICC's 10 December 2022 report records Kishan's 210 from 131 deliveries against Bangladesh. Guinness World Records identifies the double-century milestone as 200 from 126 balls and lists twenty-four fours and ten sixes in the completed innings. Those facts refer to a specific ODI, not every match or format in his career.
The distinction between milestone and final score matters. A player can reach a landmark and continue batting. A headline about the speed of the landmark may therefore use fewer balls than the completed innings record. The two figures are not contradictory when each is correctly labelled.
Keep the opponent, date and format with the number. A search for a player can surface an old record beside recent news. Without the date, a reader might assume that the double-century happened in the latest match simply because the page was opened or updated today.
What is a wicketkeeper-batter?
The label combines a batting role with the specialist fielding position behind the striker's wicket. It does not mean the player necessarily keeps wicket in every match. The playing eleven and scorecard establish who held that role in a particular fixture. A general profile should not substitute for those match-specific details.
For an original classroom example, imagine two players capable of keeping wicket selected in the same side. One takes the gloves while the other fields elsewhere. Both can be described by their wider skill set, but only one is the wicketkeeper for the relevant passage of play.
When analysing a real scorecard, keep batting, catches and stumpings in their appropriate categories. A catch in the field and a stumping are not the same dismissal contribution. Clear labels help beginners appreciate a dual-role player without collapsing every action into the batting total.
How is batting strike rate calculated?
Batting strike rate is runs scored divided by balls faced, multiplied by one hundred. It expresses a rate per one hundred balls, not a percentage of successful shots or a count of boundaries. The number can exceed one hundred because more than one run can be scored from a ball.
For the documented 210 from 131, the calculation is approximately 160.3 runs per one hundred balls. That does not mean Kishan faced one hundred balls or scored exactly 160.3 runs in a particular segment. It scales the whole innings to a common reference so readers can compare scoring pace more easily.
For an original fictional example, forty runs from twenty-five balls gives 160. The rate resembles the historical innings' rate, but the size of the innings and the sample differ greatly. Similar rates do not make two performances equivalent in every sporting respect.
Why is a strike rate not a boundary percentage?
Strike rate includes all batting runs in its numerator. A batter can reach the same rate through different combinations of boundaries, singles, twos and other scoring events. You need the event breakdown to discuss how the runs were accumulated. The rate alone does not reveal the shot pattern.
Use an original twenty-ball example. Batter A scores thirty runs with several boundaries, while Batter B reaches thirty through another distribution of scoring shots. Both have a strike rate of 150. The equal rates describe pace over the sample, not identical technique or identical decisions at the crease.
Do not infer a particular number of dot balls from runs and balls alone. Several different sequences can produce the same total. A detailed claim about scoring rhythm requires ball-by-ball information or another verified breakdown rather than a confident reconstruction from two headline figures.
How many runs came from boundaries in the 210?
Using the recorded twenty-four fours and ten sixes, boundary runs are twenty-four multiplied by four plus ten multiplied by six: ninety-six plus sixty equals 156. Subtracting 156 from the final 210 leaves fifty-four batting runs outside those recorded boundary events. This is a calculation from the published figures, not an additional independently observed statistic.
The boundary share is 156 divided by 210, approximately 74.3 percent. That percentage describes the share of batting runs represented by the listed fours and sixes. It is not the percentage of balls that were boundaries, the percentage of shots played well or a measure of the team's entire innings.
Keep the denominator explicit. A chart labelled only “74.3%” invites misunderstanding. “Share of Kishan's innings runs from recorded fours and sixes” is longer but much clearer. Good statistical writing helps the reader identify exactly what the percentage measures.
Can you infer the number of singles from that calculation?
No. Fifty-four non-boundary batting runs could come from different combinations of singles, twos, threes or other scoring events. The total alone does not identify the distribution. A full event record is needed before attaching a specific number of singles or running patterns to the innings.
For an original fictional exercise, six non-boundary runs could be six singles, three twos or a three plus three singles, among other possibilities. All combinations have the same run total. The ambiguity demonstrates why subtraction can establish a remainder without revealing every event that produced it.
The same caution applies to balls. Thirty-four recorded boundary strokes do not by themselves explain the complete sequence of the other ninety-seven balls faced. Avoid filling that gap with invented dot-ball counts, strike rotations or descriptions of particular deliveries.
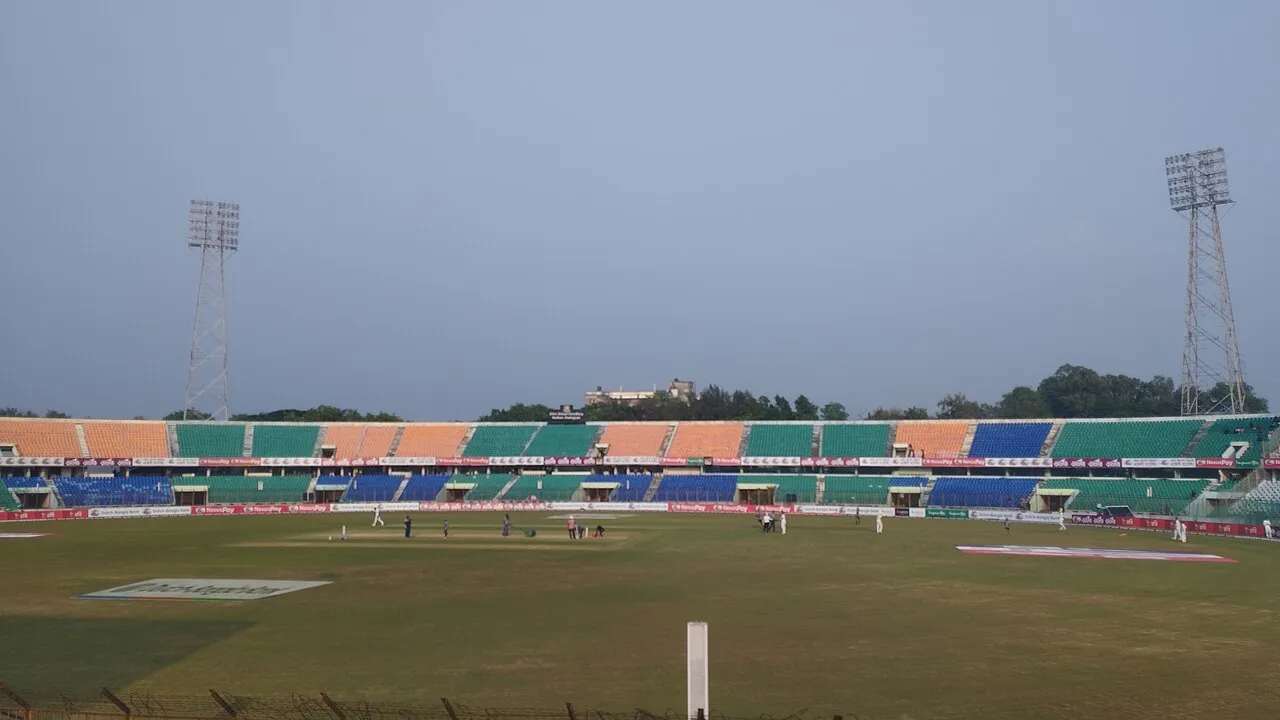
Historical venue photograph, not an image of the December 2022 innings.
How do the milestone and final rates compare?
The historical double-century milestone uses 200 runs and 126 balls, while the final record uses 210 and 131. Calculate each rate from its own pair of inputs. Mixing the milestone's runs with the final innings' balls would produce a rate that describes neither actual point correctly.
Two hundred divided by 126 and multiplied by one hundred is approximately 158.7. The final rate is approximately 160.3. The difference shows that the aggregate rate changed after the milestone. It does not identify which exact shots occurred in the intervening deliveries without a verified event list.
An original worksheet can place milestone, runs, balls and calculated rate in four columns. Ask learners to check each row independently before comparing them. This is a useful habit in any cumulative dataset, where a later total must remain paired with the corresponding later amount of time or opportunity.
Why distinguish an innings score from a team score?
A player's batting score is part of the team's innings, but the team can also receive runs from other batters and extras. A record of 210 does not mean the team scored only 210. The full scorecard is needed to describe the team's total, wickets and contributions from others accurately.
For an original fictional innings, one batter scores sixty, another forty and extras add ten. The team has at least 110 from those entries, not sixty. If additional batters contribute, include them too. A star player's score can be the most prominent number in a headline while still representing only part of the innings.
The reverse error is to attach the team total to the individual. A player profile should not acquire a larger score because a summary card has unclear labels. Preserve the distinction in both prose and interface design, using separate fields for batter runs and team runs.
What do record labels need?
A record label needs its category and reference date. Fastest to a double-century is not the same as highest completed score, fastest century or most career runs. A performance can be remarkable in one category without leading every other one. Do not shorten a precise record into an unlimited “best ever” claim.
The source cited here describes the historical double-century record. This article does not assume that every record remains unchanged indefinitely. Readers checking a present-day ranking should consult the current record authority and preserve the category used, especially when comparing men's and women's competitions or different match formats.
For an original class task, write three separate questions about an imaginary batting table: highest score, fewest balls to a milestone and most runs across a season. The answers may name three different players. A good table makes those questions possible without implying they are the same achievement.
How can selection news be read responsibly?
A player can appear in a historical profile, a franchise squad and an international announcement without those pages describing the same date or role. Check the relevant team's current official information before claiming a selection, captaincy or absence. An old withdrawal is not a permanent description of availability.
This guide focuses on verified historical performance and reading skills rather than private explanations for a career decision. It does not diagnose a player's condition or invent motives from a missing name in a squad. Public statements can be reported with attribution; private speculation is not needed to teach the sport.
In an original timeline, separate a contract announcement, a squad list and an actual appearance. Each supports a different claim. The exercise helps learners understand why an accurate headline from one month can become misleading when repeated later without its date and scope.
A practical batting worksheet
Create three fictional innings: twenty-four from sixteen balls, fifty from forty and thirty-six from eighteen. Their strike rates are 150, 125 and 200 respectively. Calculate the combined rate from the total runs and balls rather than taking an unweighted average of the three displayed rates.
The combined figures are 110 runs from seventy-four balls, giving approximately 148.6. The simple average of 150, 125 and 200 would be approximately 158.3, which overweights the shortest innings. The two calculations answer different questions; only the totals-based ratio describes the combined scoring rate across all balls in this sample.
Now add a fictional innings with zero balls recorded and a missing run value. Do not silently convert the missing value to zero or divide by zero. Mark the limitation and explain which calculation cannot be completed. Handling incomplete data honestly is part of numerical literacy.
What should you remember?
Kishan's historical 210 is useful not only as a memorable score but as a practical dataset. Keep milestone and final figures paired correctly, distinguish strike rate from boundary share and recognise which details cannot be reconstructed from totals alone. A clear calculation can deepen appreciation without pretending to replace the full match.
For more examples, explore our cricket learning guides. Start with a precise source, retain date and format, write units beside every answer and label invented activities honestly. Those habits make the next batting record easier to understand, whether the number is a double-century or a much smaller innings.
When presenting the boundary calculation, retain both the input counts and the formula. A reader should be able to reconstruct 156 from the listed fours and sixes without trusting an unexplained graphic. Then label the fifty-four-run remainder carefully: it is a remainder in batting runs, not a verified count of singles. Showing the working protects the useful calculation from being stretched into a claim the source data cannot support.
Keep the input labels visible whenever the calculation is reused.
To distinguish batting rates from bowling rates, continue with our Blair Tickner guide.
Sources
- ICC: Kishan's Bangladesh innings, dated 10 December 2022, for the historical 210 from 131.
- Guinness World Records: double-century milestone, for the 200-from-126 milestone and boundary breakdown.
- ICC: Ishan Kishan profile, for player identity. Derived calculations are identified in the text; all other batting samples are fictional educational examples.
Image credits: cover: Tata Ipl 2022, source, CC BY 3.0. Resized and converted to WebP. inline: Al Riaz Uddin, source, CC BY-SA 4.0. Resized and converted to WebP.
Found an error or an outdated detail? Report a correction with the article URL and original source.