
Lakers Beat Kings 116-103: Dončić’s 40 Points and the Shooting Maths Explained
Check the 4 November Lakers win in Sacramento, reconstruct Dončić’s 40 points and calculate shooting rates without confusing points, rebounds and assists.
The Los Angeles Lakers beat the Sacramento Kings 116-103 on 4 November 2026 at Golden 1 Center. Luka Dončić finished with 40 points, nine rebounds and seven assists. The completed NBA game is identified by ID 0022600185, which helps distinguish it from another meeting between the same teams or an earlier preview.
This guide starts with the verified result and uses Dončić's shooting line to explain basketball statistics. It separates actual game figures from editorial calculations and avoids claiming an all-time record or a future playoff outcome. The aim is to make the numbers understandable, not simply repeat a points total beside a photograph.
What was the Lakers versus Kings result?
Los Angeles won by 13 points, calculated by subtracting Sacramento's 103 from the Lakers' 116. The date here is the game's North American schedule date. Readers in Pakistan may have followed the action on the next local calendar day, so the date and timezone should remain visible when comparing listings.
| Item | Completed-game record |
|---|---|
| Away team | Los Angeles Lakers |
| Home team | Sacramento Kings |
| Final | Lakers 116, Kings 103 |
| Date | 4 November 2026 |
| Venue | Golden 1 Center |
| NBA identifier | 0022600185 |
| Margin | 13 points |
A search for Kings versus Lakers can retrieve multiple fixtures, preseason meetings and older highlights. Match the date, venue and game identifier before copying a score. A correct number from a different meeting is still the wrong answer to a question about this game.
Dončić's line: more than the 40-point headline
The recorded line includes 11 made field goals from 23 attempts, with six makes from 13 three-point attempts. The associated free-throw line is 12 from 13. Together these entries explain the 40 points rather than leaving the reader to assume that every point came from a field goal.
| Measure | Recorded figure |
|---|---|
| Points | 40 |
| Rebounds | 9 |
| Assists | 7 |
| Field goals | 11 of 23 |
| Three-pointers | 6 of 13 |
| Free throws | 12 of 13 |
The categories are nested in an important way: the six made three-pointers are part of the eleven made field goals. They are not six additional field goals to be added on top. That relationship is essential for reconstructing the points without double-counting the same baskets.
Rebuild the 40 points step by step
Subtract the six made three-pointers from the eleven total made field goals to obtain five made two-pointers. Those five baskets contribute ten points. The six three-pointers contribute eighteen. Add the twelve successful free throws and the total is ten plus eighteen plus twelve, which equals forty.
This calculation is a useful check on a copied stat line. If the scoring components do not reconcile with the points total, look for a transcription error or a missing heading. Do not immediately assume the official record is wrong; a shifted column or a mistaken made-attempted entry can explain the mismatch.
For students, write the general relationship as two times made two-pointers, plus three times made three-pointers, plus made free throws. Then test it using clearly fictional examples. The formula explains scoring composition; it does not describe how difficult the attempts were or the sequence in which the points arrived.
Why field-goal percentage needs the attempts
Eleven divided by 23, multiplied by 100, gives approximately 47.83 percent. That is the field-goal percentage calculated from the recorded line. The underlying fraction should stay beside the percentage because eleven makes from 23 attempts supplies more context than a rounded number alone.
The three-point calculation is six divided by thirteen, or approximately 46.15 percent. It uses a subset of the field-goal attempts, not an additional thirteen attempts outside the 23. Keeping the nesting clear helps readers understand why the two percentages cannot simply be added together.
These percentages describe this game. They do not establish a season average or a permanent level of shooting accuracy. A strong night and a long-term rate answer different questions. If comparing a season, use the season's total makes and attempts under the relevant definition rather than treating one game as the whole sample.
Free throws and the points reconstruction
Twelve successful free throws from thirteen attempts produce approximately 92.31 percent for this game. In the scoring reconstruction, each successful free throw contributes one point. The missed attempt does not add a point, and the number of attempts should not be mistaken for the number of makes.
The total also illustrates why field-goal percentage alone does not describe a player's entire scoring contribution. A player can add points at the free-throw line, which is a separate category. A recap that reports only shots from the field leaves part of the scoring record unexplained.
This does not mean free-throw accuracy is a complete measure of offensive performance either. A table records outcomes under defined categories. Evaluating how opportunities were created, how possessions unfolded and how teammates contributed requires a fuller account. The calculation is precise about the category it measures and limited about what it cannot establish.
What is effective field-goal percentage?
Effective field-goal percentage adjusts the made-field-goal calculation to account for the extra point from a three-pointer. Using the conventional formula, add half the made three-pointers to made field goals, divide by field-goal attempts and multiply by 100. It is a defined scoring measure, not a new category of basket.
For the recorded line, the calculation is eleven plus half of six, giving fourteen. Fourteen divided by 23 is approximately 60.87 percent. The result differs from ordinary field-goal percentage because six of the makes carried three points rather than two. It does not include the free-throw contribution.
Label the measure when using it. Printing 60.87 percent without effective field-goal wording could make readers think it is the ordinary shooting percentage. Two correct calculations can look contradictory if the headings disappear. A clear statistical explanation preserves both the formula and the name.
How much of the team total did 40 points represent?
Forty divided by 116 is approximately 34.48 percent. That is Dončić's share of the Lakers' points in this game, calculated from the completed totals. It is not his share of every form of offensive work, and it should not be described as a complete measurement of influence.
Assists are one reason the distinction matters. A pass leading to a teammate's basket can contribute to the team without adding those points to the passer's own scoring column. Simply adding the passer's points to every teammate's points again would double-count the team's total.
For a class exercise, ask which question the fraction answers. It answers what share of the team's recorded points was credited to the player as scorer. It does not answer who created every opportunity, who defended best or how the team would have performed without that player. Those require different evidence.

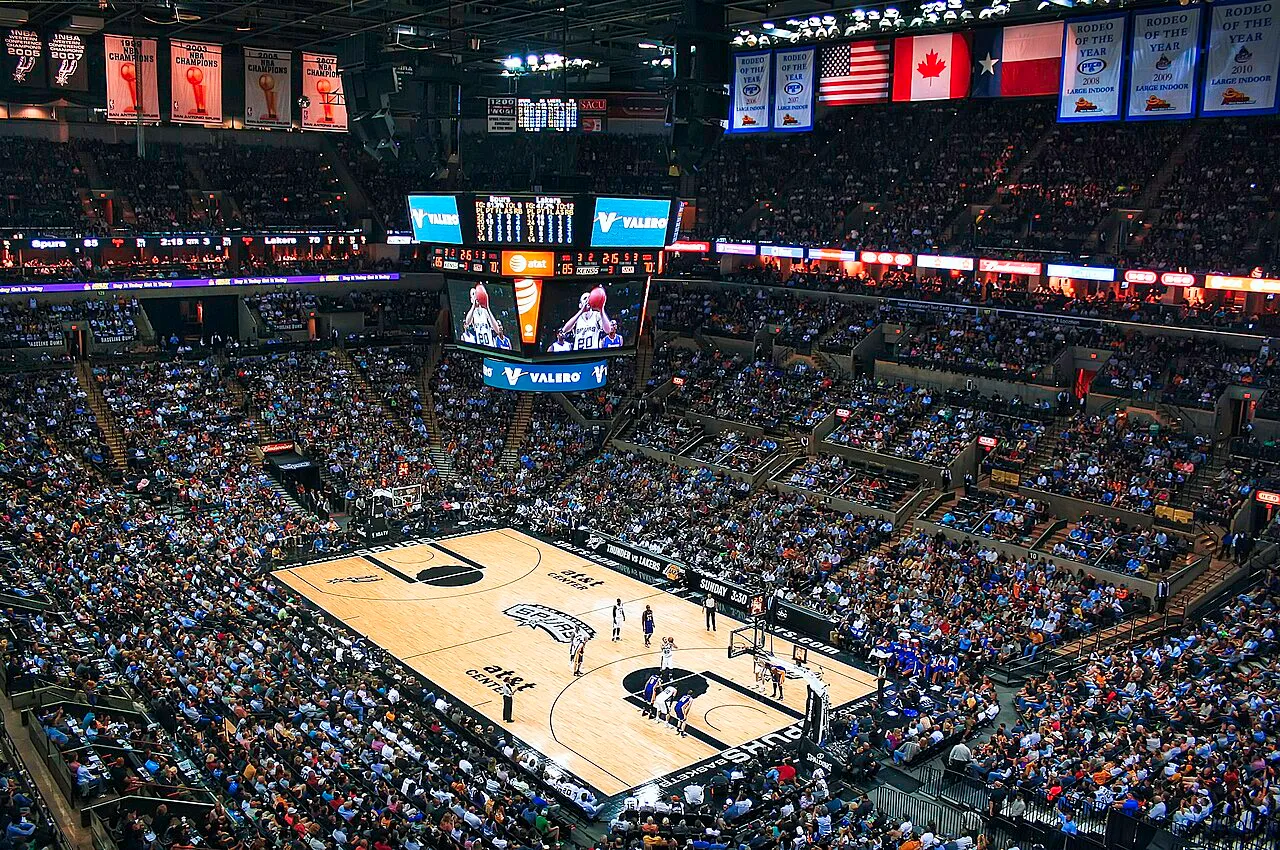
An aerial view of Golden 1 Center, shown as venue context rather than a photograph taken during the Lakers versus Kings game.
Rebounds and assists should not be converted into points automatically
Nine rebounds and seven assists are separate entries in the recorded line. They add information about participation, but they are not nine and seven extra scoring points. A reader should not add forty, nine and seven and call the result the player's contribution to the final score.
An assist can lead to a two-point or three-point basket, while a rebound can occur in different situations. The exact sequence matters if a writer wants to calculate related outcomes. Without the event-level record and a stated definition, a single aggregate count does not supply every additional calculation.
This is a useful general lesson about mixed units. Points, rebounds and assists are all numbers, but they measure different things. Adding unlike units can produce an impressive-looking total with no clear meaning. A sound comparison keeps categories separate unless a defined metric explicitly explains how they are combined.
Margin and game shape are different questions
The final margin was thirteen. That does not independently establish whether the Lakers led throughout, overcame a deficit or extended an advantage late. A full account of the game's shape requires period scores or play-by-play. The final total compresses the contest rather than preserving every change of lead.
For an invented example, a team can win by thirteen after trailing at halftime, or win by thirteen after seeing an earlier twenty-point lead reduced. Both finish with the same margin, but their narratives differ. A recap must use the actual sequence rather than choose whichever story sounds more dramatic.
The verified result and shooting calculations are enough for this guide's purpose. It does not invent a locker-room speech, a decisive tactical instruction or an emotional reaction from a player. Those details should come from attributable reporting, not from the writer's attempt to make the score feel more cinematic.
One game is not a complete season forecast
A substantial individual scoring performance and a team win matter to the season record, but neither establishes a final conference position or championship outcome. The remaining schedule is not a repeat of one completed game. Future availability, opponents and performance need their own evidence.
Similarly, a loss should not be used to erase every other part of Sacramento's season. A fair analysis defines its period. This game, the last five games and the entire season are different samples. A statistic can be accurate within one sample while answering a different question from the one a reader intended.
Avoid a historical superlative unless the relevant comparison has been checked. A forty-point game is clear without a guessed franchise record or a claim that nobody has done something before. The stronger headline is the one the scorecard can support, not the one with the broadest unverified scope.
How to compare two player lines responsibly
Choose the same competition and period, then keep minutes, attempts and roles visible where available. A player taking more attempts can score more points while shooting a lower percentage. That is not a contradiction; it means volume and accuracy are different dimensions of the record.
Do not average percentages blindly across games. A fictional one-for-two game and a nine-for-ten game combine to ten makes from twelve attempts, about 83.33 percent. The simple average of their 50 and 90 percent figures would be 70, which does not match the combined attempts. The denominator matters.
When building a spreadsheet, store makes and attempts separately and calculate the rate from totals. That makes later corrections easier and avoids a common statistical error. The same method applies to exam results, survey response rates and other situations where groups have different sizes.
Viewing dates and authentic game records
An NBA listing's North American date can differ from the date on a Pakistan viewer's clock. Preserve the source timezone when converting a start time. The difference does not create a second game, and it should not be used to attach a score from a different fixture merely because the calendar day matches locally.
The game identifier is especially useful here. It ties a box score, recap and highlights entry to the same event. If a source supplies only a title without a date, check the underlying event before copying statistics. Repeated team names are not enough to establish identity across a season.
Legal broadcast availability is a separate question from a public box score. A service available in one market does not automatically provide access in another. This article links to records rather than an unverified streaming page or an offer requiring readers to disclose unrelated account information.
Historical photographs should keep their context
A photograph of the arena can identify the setting without being taken during this game. An older Lakers or Kings image can illustrate the clubs without showing the current lineup. The captions on this page state the historical or illustrative role where applicable rather than presenting archive material as new action.
This is important when an athlete has changed teams or a venue has a different use. A recognisable uniform or court is not enough to establish the photograph's date. Read the source description before attaching a current result to an image, and keep the qualification visible when sharing it.
For a student news project, treat image captions as part of the factual work. The result table, date, photo and credit should tell a consistent story. A correct score beneath a misleading image can still create a false impression, even if every number in the table is accurate.
Questions about Lakers 116-103 Kings
Did Dončić's eleven field goals mean eleven two-pointers?
No. The six made three-pointers are included in the eleven field goals. Subtracting them leaves five two-pointers. Ten points from those baskets, eighteen from threes and twelve free throws reconstruct the recorded forty-point total without double-counting.
Is 60.87 percent the ordinary field-goal percentage?
No. It is the effective field-goal calculation explained above. Ordinary field-goal percentage from eleven of 23 is about 47.83 percent. Each measure needs its label; displaying an unlabeled percentage would hide the distinction rather than help readers understand the performance.
Where can students practise these calculations?
Use class resources for ratios and tables or programming courses to build a simple stat calculator with clearly named inputs. Keep real game records separate from fictional exercises. The completed result remains Lakers 116, Kings 103, on 4 November 2026.
Sources
- Source: NBA official game record, 0022600185
- Source: NBA game breakdown
- Source: Dated box score and player figures
- Source: Independent game box-score record
Image credits: cover: Katie Haugland Bowen, source, CC BY 2.0. Resized and converted to WebP. inline: Quintin Soloviev, source, CC BY 4.0. Resized and converted to WebP.
Found an error or an outdated detail? Report a correction with the article URL and original source.