
Liquefied Natural Gas: LNG Science, Transport and Units Explained
Learn what LNG is, how cooling reduces its volume, how it differs from CNG and LPG, and how to read energy units through clear classroom examples.
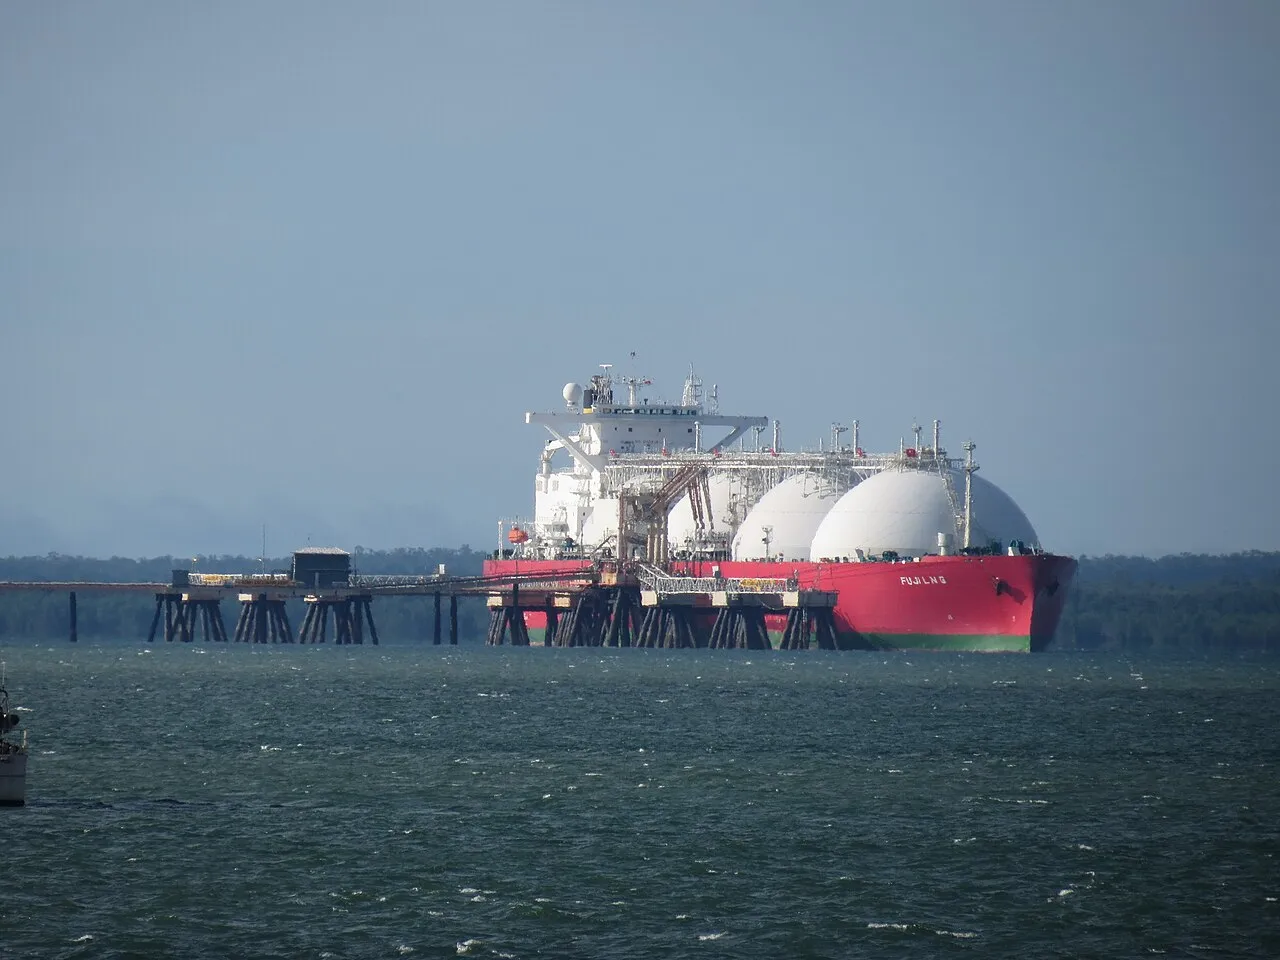
Liquefied natural gas, or LNG, is natural gas cooled into a liquid so that it occupies much less space during storage and transport. It is not the same product as LPG, and it is not simply another name for compressed natural gas. Understanding those distinctions helps students follow energy news without confusing the fuel, its physical state and the way it reaches a customer.
This guide was reviewed on 2 November 2026. It explains the science and basic supply chain using official energy references and original classroom calculations. It does not provide a live LNG price, a household handling procedure or a forecast of Pakistan’s next fuel tariff. Practical cryogenic equipment requires specialist systems and trained personnel.
What does LNG stand for?
LNG means liquefied natural gas. Natural gas is primarily methane, while its precise composition can vary. The liquid form is achieved through very low temperature rather than turning the material into a different fuel by giving it a new name. The abbreviation describes a physical form used within a wider energy system.
For a simple analogy, think about water and ice: a change of state does not necessarily mean a substance has become a completely unrelated material. The analogy has limits, because LNG is a different substance with very different conditions and hazards. It is a conceptual comparison, not an invitation to attempt a home experiment.
Write three fields in a notebook: material, state and purpose. For LNG, the state is liquid and the purpose discussed here is compact storage and transport. This structure helps learners avoid mixing a chemical identity with a commercial product name or an equipment label.
How cold is LNG?
The US Department of Energy describes cooling natural gas to about minus 260 degrees Fahrenheit, approximately minus 162 degrees Celsius, for liquefaction. Preserve “about” because this is an explanatory reference value, not a universal operating instruction for every mixture, pressure or piece of equipment.
Use the temperature-conversion formula as an original mathematics exercise: subtract 32 from Fahrenheit, then multiply by five ninths. Starting with minus 260 gives approximately minus 162.22 Celsius. Rounding produces the commonly stated minus 162. The calculation demonstrates unit conversion; it does not design a liquefaction plant.
Ask students why the negative sign matters. Minus 162 is not a smaller version of plus 162 in a practical sense; they describe entirely different conditions. A chart that drops a sign can communicate a serious error even when the remaining digits are correct. Technical literacy begins with preserving the unit and sign together.
Why does liquefaction help with transport?
Official energy explanations describe LNG as occupying roughly one six-hundredth of the volume of natural gas in its gaseous state under the comparison conditions. That large reduction makes long-distance shipping practical where a pipeline connection is not feasible. The comparison concerns volume, not a disappearance of most of the material’s mass.
Consider an idealised classroom calculation. If a specified gas volume is 600 units under the reference conditions, the rough liquid-volume comparison is one unit. If it is 1,200 gas-volume units, the corresponding simplified liquid figure is two. Keep the reference conditions attached to the comparison rather than applying the ratio to any compressed gas volume.
This is a model, not a tank-sizing instruction. Real engineering requires composition, temperature, pressure, storage margins and other information. The educational value lies in seeing why a change of state can make a transport option useful, while understanding that the headline ratio is not a complete design specification.
Does less volume mean less energy?
A smaller volume does not automatically mean proportionally less total energy when the amount and composition of material are being considered. Volume and energy are different quantities. The same container size can hold different amounts of a fuel under different conditions, so a bare volume number is not enough to compare every energy product.
Use a fictional packing example: ten folded sheets occupy less space than the same ten sheets loosely arranged, but the count remains ten. This illustrates the distinction between amount and occupied space, not the molecular behaviour of LNG. Label the analogy clearly so that learners do not treat it as a physical model of liquefaction.
When reading an energy contract or report, check whether the unit describes volume, mass or energy. Do not compare a price per tonne directly with a price per unit of energy without an appropriate conversion and assumptions. The first task is identifying what each number measures, not rushing into arithmetic.
What happens between production and use?
At a broad level, the LNG chain includes gas preparation, liquefaction, insulated storage, transport, receipt and regasification before the gas enters an appropriate distribution system. The Department of Energy describes specialised ships and receiving terminals as parts of that chain. Each stage has a role; the fuel does not simply move from an ordinary ship directly into a household appliance.
Draw a block diagram with one box for each stage. Use arrows to show movement and label where the material is liquid or gas. Keep the diagram conceptual. Do not add valves, pressures or operating sequences that would turn a classroom illustration into incomplete practical instructions.
Ask learners to remove one box and explain what information is now missing. Without regasification, the diagram does not show how the liquid becomes gas for downstream use. Without storage, it may ignore the timing difference between a ship’s arrival and later demand. A clear diagram helps explain the system’s purpose.
LNG, CNG and LPG: how are they different?
CNG is compressed natural gas, while LNG is natural gas in a cryogenic liquid form. LPG is a different fuel category associated with liquefied petroleum gases such as propane and butane. The familiar abbreviations can appear together in transport or energy discussions, but their storage systems and product identities are not interchangeable.
The Alternative Fuels Data Center explains CNG and LNG within its natural-gas material and propane separately. That separation is useful for learners. Do not assume that a cylinder associated with one fuel can be used for another, or that a shared word such as “gas” means the equipment and handling requirements are the same.
Create a comparison table with name, broad composition, storage principle and source. Leave technical handling to qualified guidance. The purpose is to recognise the categories, not to teach a home conversion. A well-designed table can prevent confusion without overwhelming beginners with specifications they are not equipped to use safely.
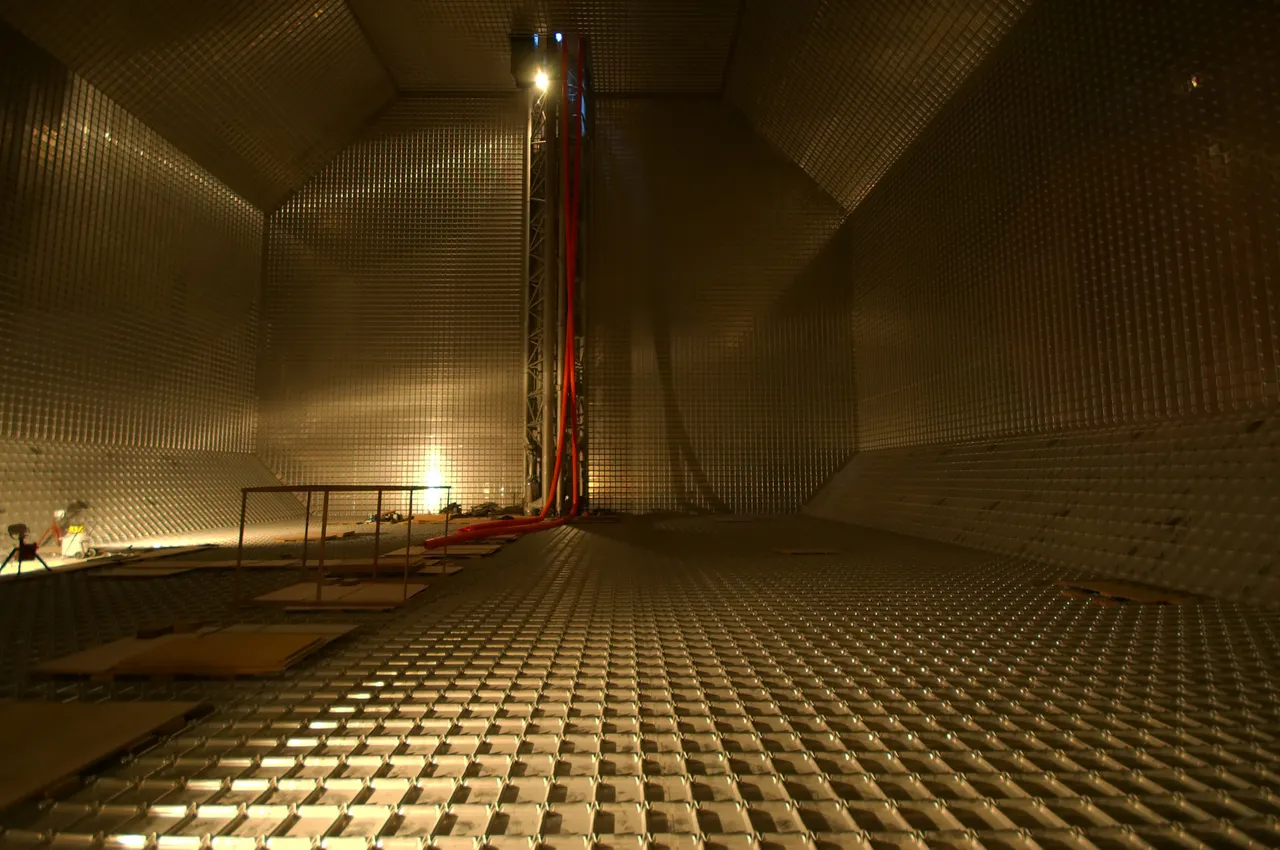
Specialised LNG tank context, not an ordinary storage container or a handling guide.
Why does a ship’s capacity differ from a country’s demand?
A storage or cargo capacity describes a quantity at one time. Demand often describes a quantity over a period. Comparing the two requires a time basis and consistent units. A large cargo is not automatically “a month’s supply” unless the relevant consumption rate and usable quantity are established.
Use an invented example with 100 energy units of usable stock and a demand rate of ten units per day. A simplified calculation gives ten days, assuming no additional supply or losses and constant demand. Change the daily rate to 20 and the same stock lasts five days. The assumptions belong beside the answer.
This is not a calculation of Pakistan’s current reserves or a real cargo’s endurance. It teaches the difference between stock and flow. Once learners understand that distinction, they are less likely to accept a dramatic claim that compares a one-time quantity with an undefined rate.
What affects the cost of imported energy?
A classroom cost model can separate purchase price, quantity, transport and currency conversion. These are not all the components of an actual LNG contract, but they help explain why a change in one headline commodity price does not automatically predict a customer’s bill. Real charges depend on the relevant arrangements and period.
For an original example, multiply 100 fictional energy units by five fictional dollars per unit to get 500 dollars. Convert at an invented rate of 200 rupees per dollar to get 100,000 rupees. Then change only the exchange rate. The exercise shows which input caused the output to change without presenting a real market quotation.
Keep the model labelled as fictional and incomplete. Do not use it to claim a current tariff or recommend a financial decision. Our oil and Pakistan cost-channel guide develops the broader lesson that commodity prices, exchange rates and final business outcomes are related but distinct.
Is LNG automatically identical to a household gas tariff?
No. A wholesale commodity reference and a billed customer tariff are different records. A tariff can depend on the customer category, billing period and applicable components. This article does not derive a household bill from a global LNG headline or assume that every customer receives the same price.
Imagine a fictional bill with a usage component and a fixed component. If the usage rate changes while the fixed amount remains the same, the total does not necessarily change by the same percentage as the usage rate. The example illustrates bill structure, not the actual rules used by a Pakistani supplier.
When checking a real bill, use the supplier’s current official explanation and the relevant period. An old article can explain terminology without confirming today’s rates. Keep the educational model separate from practical billing advice, and do not treat an unattributed social-media price as an official notification.
What should an environmental comparison specify?
An environmental claim needs a defined comparison and boundary. Does it concern a combustion stage, a complete supply chain, a unit of fuel or a unit of electricity produced? Without that information, a broad statement that one option is simply “clean” or “dirty” can hide important differences in what is being measured.
For a fictional classroom project, compare two imaginary transport chains using supplied emissions values for each stage. Add the stages consistently and state what is excluded. Then change the boundary to include another stage. Students can see why two totals may differ because the questions differ, not necessarily because someone performed addition incorrectly.
This article does not supply a universal emissions ranking or a lifecycle estimate for a particular LNG cargo. Such an assessment needs an appropriate dataset and method. The learning goal is to ask which stages and units a claim includes before accepting a percentage as a complete environmental conclusion.
How can a diagram avoid misleading readers?
Show the material’s state at each broad stage and identify which arrows represent transport rather than transformation. Use consistent symbols and readable labels. A liquid-storage icon should not imply that ordinary household tanks are suitable. The diagram is an explanation of a supply chain, not a construction drawing.
Historical photographs should also be labelled precisely. A ship can illustrate LNG transport only if its type is verified; an oil tanker is not automatically an LNG carrier. A terminal image from another country can provide context without being relabelled as a Pakistani facility or a current shipment.
For a classroom task, provide two deliberately different diagrams and ask which one keeps the states and stages clear. Let students explain their choice. The exercise teaches that an attractive image is not necessarily an accurate model, and that good design helps the reader preserve the distinctions the science requires.
Build a unit-aware learning tool
Start with a simple temperature converter or a fictional stock-and-demand calculator. Label each input with its unit and validate the values. A program should not divide a cargo quantity in one unit by a demand rate in another and display the result as days without conversion.
Learners can create this through our programming courses. Test a known temperature conversion, a zero-demand case and a missing input. Explain why zero demand should not produce an ordinary finite duration. These checks teach meaningful behaviour instead of merely verifying that the interface displays a number.
Keep the tool educational. Do not connect it to real cryogenic equipment or claim that it performs operational planning. A useful small project makes assumptions visible, shows its formula and explains its limits. That clarity is part of correctness, especially when technical terms can make an oversimplified calculation appear more authoritative than it is.
Questions to check understanding
Can you explain why LNG occupies much less space without saying that most of its mass disappears? Can you distinguish LNG from CNG and LPG? Can you identify the difference between a quantity in storage and a rate of demand? These questions connect the abbreviation to a useful understanding of the system.
Next, choose a headline number and ask what its unit, date and comparison conditions are. If those are missing, write the question you would need answered before calculating. LNG becomes easier to understand when readers separate material, state, transport, cost and time instead of treating them as one interchangeable concept.
Sources
- US Department of Energy: liquefied natural gas, for the temperature, volume comparison and broad transport chain.
- US Energy Information Administration: LNG explained, for natural-gas and LNG context.
- Alternative Fuels Data Center: natural gas basics, for CNG and LNG distinctions.
- Alternative Fuels Data Center: propane basics, for propane/LPG context. All prices, inventories, exchange rates and classroom calculations here are invented examples, not current tariffs, contract terms or handling instructions.
Image credits: cover: Ken Hodge, source, CC BY 2.0. Resized and converted to WebP. inline: Thinfourth, source, CC0. Resized and converted to WebP.
Found an error or an outdated detail? Report a correction with the article URL and original source.