
Nuggets Beat Grizzlies 123–118: Murray’s Late Scoring and Team Statistics
Understand Denver’s 123–118 win, Murray’s fourth-quarter scoring and the team’s shot totals through clear percentage calculations and labelled examples.
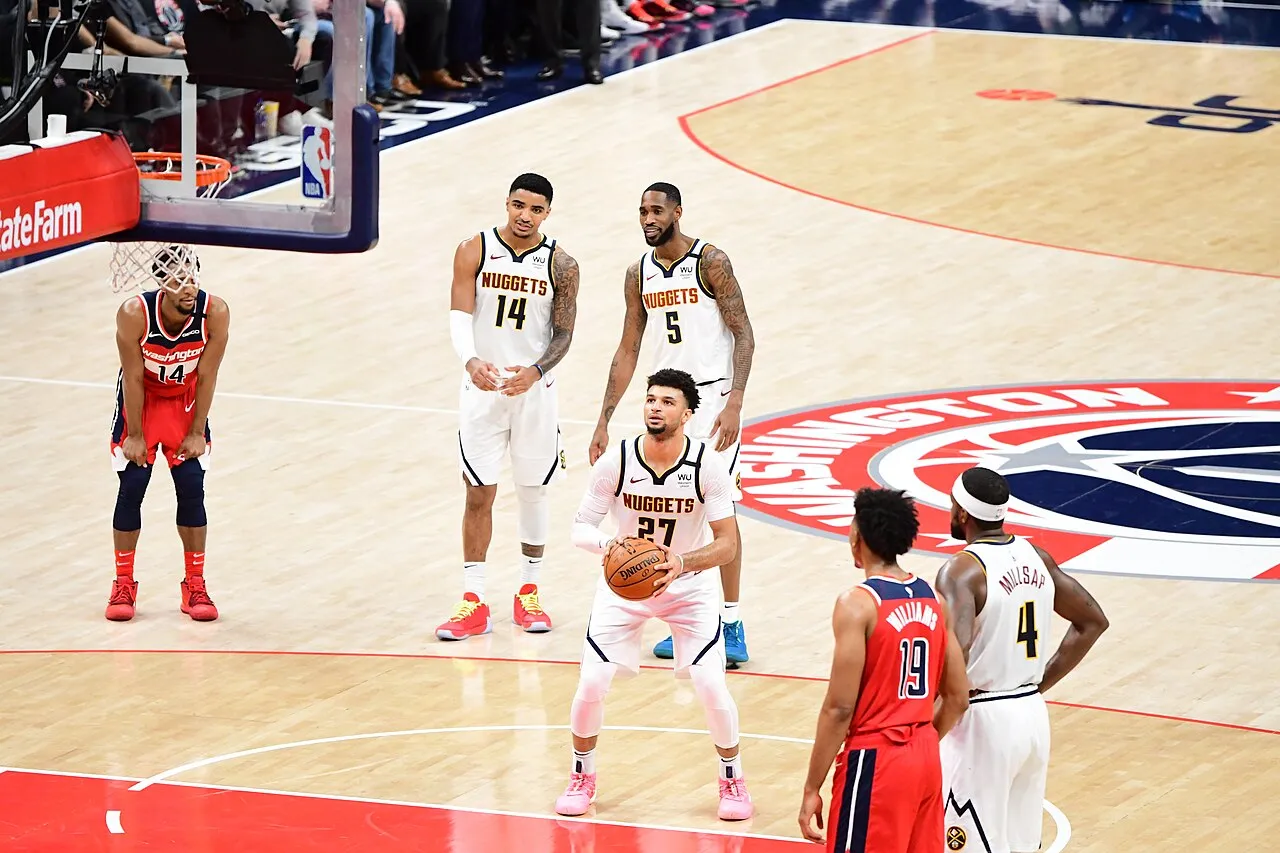
Denver defeated Memphis 123–118 on 11 November 2026. The completed result is supported by Denver's official recap and the published game record. Jamal Murray's reported 30 points included 17 in the fourth quarter, making this a useful example of how a player's contribution can be concentrated late without describing the whole game as a one-person performance.
This guide examines the result through three different lenses: the distribution of scoring over time, a player's share of team scoring and the arithmetic behind Denver's made baskets. The calculations are original explanations of the cited record. They are not an invented play-by-play, a medical update or a prediction about the next fixture.
What the completed record says
The final margin was five points. The quarter totals were Denver 35, 30, 29 and 29; Memphis 24, 28, 38 and 28. The published recap credits Murray with 30 points and Nikola Jokic with 27 points, 11 rebounds and eight assists. These are completed-game figures rather than an intermediate scoreboard snapshot.
Denver's listed team shooting totals were 49 made field goals from 98 attempts, including 14 threes from 38 attempts, and 11 made free throws from 16. The figures provide enough information to reconstruct the 123 points and to separate two-point and three-point scoring without guessing at undocumented possessions.
The following analysis keeps those categories distinct. A quarter total tells you when points accumulated at a broad level. A player total tells you who received scoring credit. A shooting line tells you how different shot categories contributed. None of those records alone establishes every decision or action in the game.
Murray's fourth-quarter share
Seventeen divided by thirty is approximately 56.7 percent. In this context, it is the proportion of Murray's own points that came in the fourth quarter. It is not his shooting percentage, the share of Denver's entire game total or a measurement of how often he possessed the ball.
Denver scored 29 points in that quarter. Seventeen divided by 29 is approximately 58.6 percent, which describes Murray's share of the team's fourth-period scoring. The two percentages are close, but their denominators answer different questions. A useful sentence identifies the denominator rather than describing either figure simply as his “percentage.”
Subtracting his fourth-quarter 17 from his total 30 leaves 13 points across the first three periods. That arithmetic establishes a broad distribution, not the order of his earlier baskets. It would be inaccurate to assign those 13 points to particular quarters without checking the relevant scoring record.
What his teammates' scoring adds to the picture
Denver's other players supplied twelve of the team's 29 fourth-quarter points, because 29 minus 17 equals twelve. That is important context alongside a headline about Murray's late scoring. A large individual share and meaningful contributions from teammates can both be true.
At the full-game level, Denver's 123 minus Murray's 30 leaves 93 points credited to other players. That does not diminish a late performance; it prevents the final team outcome from being reduced to only one category. Scoring, passing, defending and creating opportunities involve relationships that a points total alone does not fully measure.
For a fictional comparison, imagine another team whose leading scorer provides 20 of 25 fourth-quarter points but finishes with 22 for the game. Calculate both the player's late-scoring share and the team's late reliance on that player. The exercise uses invented figures to show how different distributions can produce very different stories.
Memphis's third quarter changed the available margin
Denver led 35–24 after the first period. The second-period totals made it 65–52 at halftime. Memphis then outscored Denver 38–29 in the third, leaving a 94–90 score at that checkpoint. Denver's earlier thirteen-point halftime advantage had therefore narrowed to four points.
Those calculations explain the setting for the fourth quarter without inventing a continuous scoring run. Memphis gained nine points in relative margin during the third. That does not mean it scored nine unanswered points at a particular moment. An interval difference describes the net change across the whole period.
Denver outscored Memphis by one point in the fourth, 29–28. The four-point lead at the third-quarter checkpoint consequently became the five-point final margin. The result illustrates why a team does not need a dominant final-period margin if it begins that period with an advantage and preserves enough of it.
A close finish is different from an evenly distributed game
A five-point final margin can suggest a tight contest, but it does not establish that the teams were within five throughout. The quarter checkpoints already show a wider halftime difference. To describe the largest lead or exact lead changes, consult a complete verified sequence rather than extrapolating from the final score.
Imagine a fictional game in which one team leads by twenty and eventually wins by three. Another fictional game stays within four points throughout and also finishes with a three-point margin. The final numbers match, but the paths differ. A good recap identifies which level of detail its evidence supports.
The same principle matters in data analysis more broadly. A beginning and ending value can conceal substantial movement between them. Quarter checkpoints add detail, while possession records add more. Choose the level appropriate to your question rather than pretending that a single final difference describes an entire process.
Reconstruct Denver's 123 points
Of Denver's 49 made field goals, 14 were threes. Subtracting leaves 35 made two-point baskets. Those twos produced 70 points. The 14 threes produced 42, and the 11 made free throws produced eleven. Add 70, 42 and eleven, and the total is 123.
This calculation is a basic consistency check. It confirms that the categories were read correctly and that three-pointers were not counted as though they contributed only two points. You can also calculate twice all field-goal makes, then add made threes and free throws: 98 plus 14 plus eleven again gives 123.
The calculation does not count possessions. An offensive rebound can extend an opportunity, and several events can occur before a team's trip ends. Do not divide points by field-goal attempts and label the result points per possession. The denominator would be different, even though both measures can sound like scoring efficiency.

Archive photograph of FedExForum in 2015, provided as Memphis venue context.
Separate volume from accuracy
Denver's ordinary field-goal percentage was 49 divided by 98, exactly 50 percent. Its three-point percentage was 14 divided by 38, approximately 36.8 percent. The remaining two-point attempts numbered sixty, and the 35 makes give a two-point percentage of approximately 58.3 percent.
Now consider attempt distribution. Thirty-eight of 98 field-goal attempts were threes, approximately 38.8 percent of the total. That percentage describes shot selection by category, not shooting accuracy. A team can take a high share of threes while making a low share of them, or the opposite. Volume and conversion must be labelled separately.
For a worksheet, give makes, attempts, points and attempt share separate columns. A row can then explain both how often a category was used and what it produced. The table becomes much more informative than placing several percentages beside one another without saying which total each uses.
Observed points per attempt are not a forecast
The 42 points from 38 three-point attempts give approximately 1.11 points per attempt in that category for this game. The 70 points from sixty two-point attempts give approximately 1.17 points per attempt. These are descriptive calculations from completed attempts, not predictions of the next shot's success.
The comparison also leaves out context such as shot quality, clock pressure and how possessions developed. It cannot establish that every three-point attempt should have been replaced with a two. A past category average is not a menu of interchangeable opportunities available to a team at any moment.
There is a further difference between a rate and a recommendation. A completed category can contain attempts taken under very different circumstances, including urgent attempts near the end of a clock. A single average groups those circumstances together. Before making a tactical claim, a reader would need more detailed evidence about the opportunities that were actually available. This is why a descriptive calculation can be correct while an attached recommendation remains unsupported. Keeping the calculation and the proposed explanation in separate sentences makes that boundary easier to review.
That is an important general statistics lesson. Describing what happened is different from demonstrating what would have happened under a different decision. A counterfactual claim requires more evidence than an arithmetic average. The numbers help ask a better question; they do not automatically answer every tactical question.
How a weighted field-goal measure changes the picture
Effective field-goal percentage gives additional weight to made threes. Its calculation adds half the made threes to made field goals, then divides by attempts. For Denver's completed line, 49 plus seven equals 56, and 56 divided by 98 is approximately 57.1 percent.
The difference from the ordinary 50 percent comes from recognising the extra point supplied by each made three. This measure still excludes free throws, so it is not a complete account of scoring or offensive performance. A useful explanation gives the formula and its scope instead of treating its technical name as an argument by itself.
In a fictional exercise, compare two teams that each make ten of twenty field goals. Give one team no made threes and the other four made threes. Their ordinary accuracy matches, but their points from those field goals differ. The weighted measure helps explain why that difference matters.
Jokic's line involves different units
The cited recap gives Jokic 27 points, 11 rebounds and eight assists. Those statistics describe different actions. They are useful together, but adding them into a number and calling it his “points” would be incorrect. Any composite measure needs an explicit definition and a reason for combining its inputs.
An assist can connect a player's involvement to a teammate's basket without appearing in the passer's individual points total. A rebound can change an opportunity without creating an immediate basket. Understanding those distinctions makes it easier to appreciate contributions that a leading-scorer headline does not fully capture.
For students, write a definition beside each category before comparing players. Then choose a narrow question, such as which players received scoring credit or how many rebounds were recorded. A clearly defined comparison is more dependable than declaring a complete hierarchy from a handful of unlike numbers.
How to keep a useful match notebook
Record the date, teams and final score first. Add quarter totals in one table and player lines in another. Keep any original calculations in a third section with their formulas. This layout prevents a derived percentage from later being mistaken for a figure directly printed in the official box score.
If you use an archive photograph, label it as archive material and identify what it illustrates. The images with this guide provide player and venue context; they are not presented as photographs of this exact game. A plausible-looking image should not silently claim an event date it does not document.
More educational explainers are available in the RayTech guides collection. The aim is to turn a completed sports result into a clear lesson about evidence and arithmetic. It is not to provide gambling advice, infer an unreported injury or guarantee how a future game will unfold.
Common questions
What was the completed Nuggets–Grizzlies result?
Denver won 123–118 on 11 November 2026. Check the date when searching because the same teams can meet more than once. A live page captured before the final buzzer can contain a partial score that should not replace the completed record.
What does Murray's 17-point fourth quarter mean?
It means 17 of his 30 points came in that period. That is approximately 56.7 percent of his own scoring and approximately 58.6 percent of Denver's 29 fourth-quarter points. The denominators differ, so the percentages describe different aspects of the same performance.
Did Denver need to win the last quarter by five?
No. Denver led by four at the end of the third and won the fourth by one, producing the five-point final margin. The calculation explains the checkpoint relationship, not the exact order of scoring inside the period.
Sources
- Denver Nuggets official completed-game recap
- Completed game record and scoring by period
- Associated Press recap and player totals
- Independent completed team-statistics record
Image credits: cover: All-Pro Reels, source, CC BY-SA 2.0. Resized and converted to WebP. inline: Trev0B, source, CC BY-SA 4.0. Resized and converted to WebP.
Found an error or an outdated detail? Report a correction with the article URL and original source.