
Why Refineries Can Absorb Higher Petrol Costs in Pakistan
Understand how refinery costs, imported-product benchmarks, exchange rates and government charges can move differently from Pakistan's pump price.
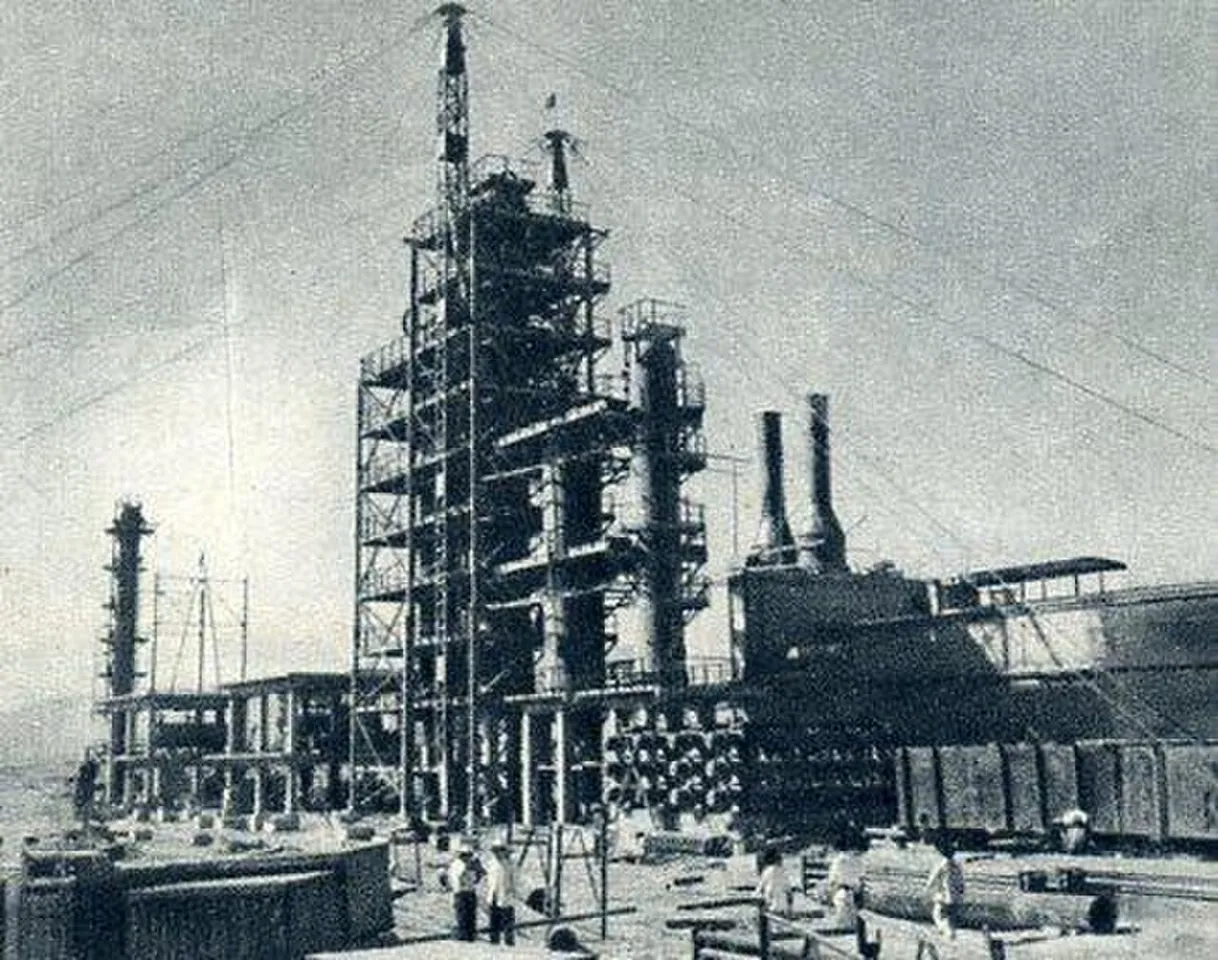
A refinery can absorb higher petrol costs when the amount it receives for selling a product rises less than the costs allocated to producing or supplying it. That is different from saying that every increase in crude oil immediately becomes the same increase at the petrol pump. Pakistan's pricing chain includes several separate components, and each can move on a different basis or timetable.
This article explains that mechanism. It does not establish a current per-litre loss, quote a new pump price or interpret a specific policy letter whose complete terms have not been read. Sources checked on 1 November 2026 include official descriptions of the price chain and a historical price-build-up table. All worked amounts below are fictional models, not current Pakistani rates.
What is the difference between crude oil, petrol and a refinery's sale?
Crude oil is a refinery input, while petrol is one of the products obtained through refining. A refinery also produces other outputs. The Energy Information Administration describes refining through separation, conversion and treatment processes, which helps explain why a barrel of crude should not be treated as a barrel containing only petrol.
A company's economics therefore depend on a product basket as well as the input price. Petrol, diesel and other outputs can have different market values. Looking at one product's selling price alone may not establish the profitability of the entire refinery.
The ex-refinery price concerns the product's value at an earlier point in the supply chain. The retail price includes further components. A consumer's payment at a filling station is not automatically the amount retained by the refinery.
The petroleum supply-chain guide provides broader background on those stages. The narrower question here is how a change at one stage can be absorbed rather than passed immediately to the next.
Which components can sit between refinery value and the pump?
Pakistan's Finance Division memorandum describes a chain that includes ex-refinery or import price, inland freight equalisation, marketing-company margin and dealer commission. Official price tables also identify applicable government charges. The presence and amount of a component should be checked for the specific product and effective date.
Do not treat the label petroleum products as one universal price. A table for kerosene does not establish the petrol rate, and a historical petrol table does not establish today's charge. Product identity is as important as the date.
| Component in a simplified chain | Question it answers |
|---|---|
| Ex-refinery or import value | What product value enters the pricing chain? |
| Freight component | How is transport-related cost represented? |
| Marketing margin | What allowance applies to the marketing stage? |
| Dealer component | What applies at the retail distribution stage? |
| Government charges | What officially notified charges apply? |
The table explains roles rather than quoting present amounts. It is useful because a headline saying the price stayed unchanged does not identify which underlying components moved.
How can costs rise while the retail price barely changes?
A retail total can remain stable if increases in one component are offset by decreases elsewhere, or if an upstream selling value does not fully reflect a cost increase. Those are different mechanisms and should not be described interchangeably.
Consider a fictional product chain with an upstream value of 210 units and combined other components of 63. The retail total is 273. If the upstream value rises by ten and another component falls by ten, the total remains 273.
Now consider a different fictional case. The upstream seller's relevant cost rises from 205 to 220, but the allowed or realised selling value remains 210. The seller's position worsens even though the consumer still pays the same total.
The first example reallocates the composition of the final price. The second creates a gap at the upstream stage. To identify which case applies in reality, read the operative notification and the company's relevant disclosures. An unchanged pump price alone cannot distinguish them.
Does a ten-unit gap mean the whole company loses ten per litre?
Not necessarily. A simplified product comparison can illustrate pressure without measuring a company's final accounting result. Actual profitability also depends on volumes, other outputs, operating costs, financing, inventory treatment and the reporting boundary.
In the second fictional example, selling at 210 against an allocated cost of 220 creates a ten-unit shortfall within that simplified model. The conclusion is limited to the assumptions supplied. It should not be copied into a report as a real refinery loss.
A product basket makes the problem more complex. Another output might earn a different margin, and production volumes may change. Maintenance, utilisation and product quality can also affect the economics. A complete analysis needs the company's actual figures.
The PSO and refinery supply-deal explainer distinguishes supply arrangements from operating outcomes. A contract's existence does not establish the margin earned on every delivery.
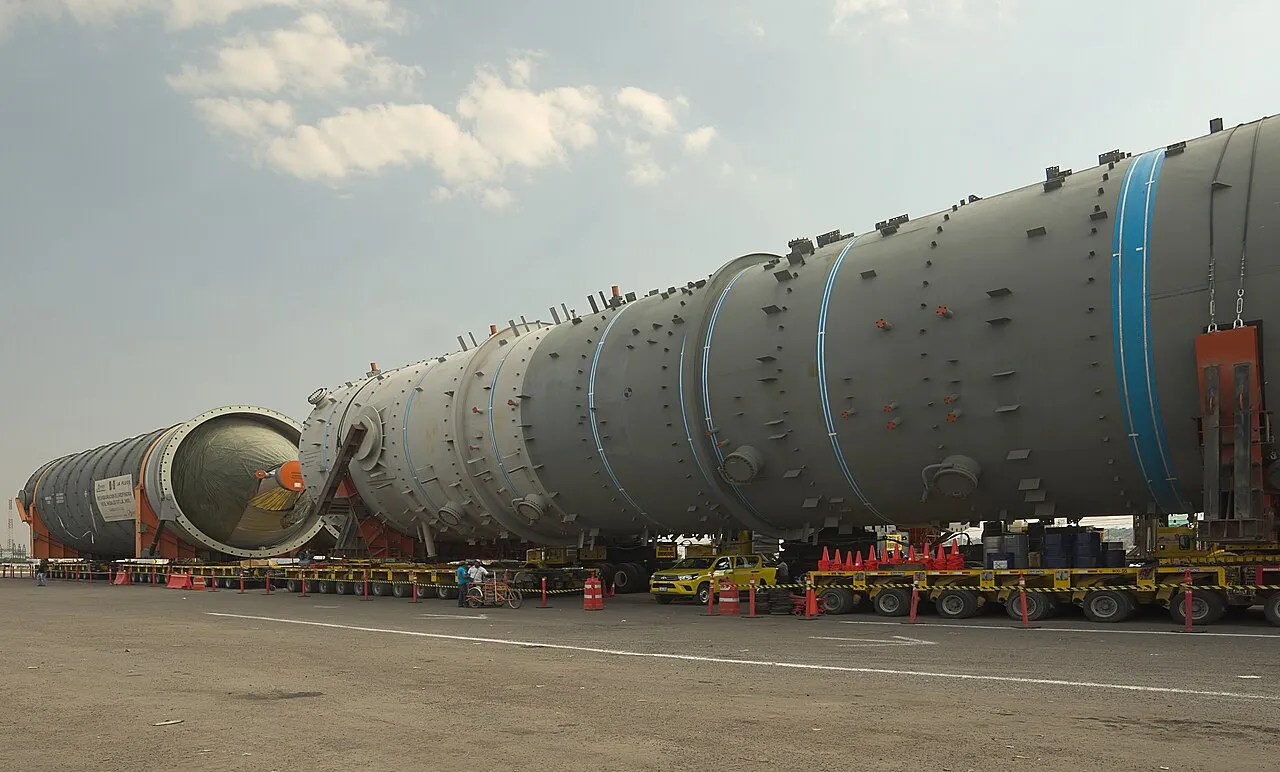
Refinery equipment in transit in Mexico illustrates the physical capital behind processing; it does not depict Pakistan's fuel supply.
What does a refining margin leave out?
A refining margin is a defined comparison between product values and relevant input costs. Different publications can use different benchmarks or calculation methods. Before comparing two margin figures, identify the basket, currency, period and costs included.
A headline spread is not automatically net profit. A business still has other costs and obligations. A positive spread can coexist with pressure from maintenance, financing or other expenses, while a short-term negative comparison may not describe an entire reporting period.
For a student calculation, create a row for each assumed product output and multiply quantity by price. Add those product values, then compare them with the specified input cost. List excluded costs below the calculation rather than quietly treating them as zero.
That exercise makes the model inspectable. Another reader can change one assumption and see which conclusion moves. It is more useful than a precise-looking margin whose underlying prices and conversion basis are unknown.
Why does the exchange rate matter separately?
If a cost is denominated in foreign currency, its rupee value depends on the conversion rate relevant to that transaction or calculation. A change in the international dollar price and a change in the rupee conversion can reinforce or offset one another.
Suppose a fictional invoice is 1,000 dollars. At an illustrative rate of 250 rupees per dollar, it represents 250,000 rupees before other costs. At 260, the same dollar invoice represents 260,000. The extra 10,000 arises from the rate assumption, not a larger dollar invoice.
Those are teaching rates, not current market quotations. An actual analysis needs the relevant date, rate basis and payment terms. Do not combine an old exchange rate with a new commodity quotation and call the result a current import cost.
The dollar buying-and-selling guide explains why different quoted rates serve different purposes. The appropriate rate for a transaction must be established rather than chosen because it produces a preferred conclusion.
How can inventory and cash timing complicate the picture?
Inventory purchased earlier can have a different cost from inventory that must be replaced now. That creates a distinction between a comparison using existing stock and one using the next purchase. Neither should be substituted for the other without explanation.
For a deliberately simple ledger exercise, assume old stock cost 180 units and is sold for 200. The difference is twenty before other costs. If replacement stock now costs 210, the next purchase requires more money than the sale brought in.
The exercise is not a claim about a particular accounting policy. It shows why historical purchase cost and replacement funding answer different questions. A full company's inventory accounting must be read from its own financial statements and applicable reporting basis.
Cash timing creates another problem. If a supplier must be paid before customers settle their bills, the business needs funds during the gap. Even a transaction expected to earn a positive margin can create working-capital pressure before cash arrives.
Who ultimately bears an absorbed cost?
That depends on the mechanism. The burden might appear as a lower company margin, a change in a government component, a later adjustment or another explicitly documented arrangement. Do not announce a subsidy, compensation right or reimbursement promise unless the official terms establish one.
A useful question is who pays whom, for which product, at what date and under which calculation. Put those fields in a table. If the alleged arrangement does not answer them, the headline may be describing an incomplete account.
Also separate a temporary calculation from a permanent rule. A measure with a stated window should not be described as the pricing system for all future periods. An announcement date can differ from the date on which its provisions apply.
For households, the practical outcome is the officially applicable retail price for their purchase. For business analysis, the upstream allocation and timing matter as well. Keeping both views visible explains why the same policy can look different from a driver's receipt and a refinery's accounts.
What is a useful way to read the next refinery-cost story?
Begin with the exact claim: higher input cost, reduced selling value, lower government charge or unchanged retail total. Then locate the document that establishes that specific relationship. A broad industry comment and an operative price notification have different evidential roles.
Preserve the product, effective period and units with every amount. Compare like with like, identify any converted currency and state whether the figure is a forecast, a realised result or a simplified example.
Finally, distinguish the mechanism from its measured impact. Understanding how a cost can be absorbed is a valuable first step. Establishing how much a particular refinery absorbed requires its own dated evidence. That distinction produces a clearer explanation of petrol economics without turning an illustrative model into a current price or company-profit claim.
Sources
Source 1 · Source 2 · Source 3 · Source 4
Image credits: cover: Unknown author Unknown author, source, Public domain. Resized and converted to WebP. inline: Carlos Valenzuela, source, CC BY-SA 4.0. Resized and converted to WebP.
Found an error or an outdated detail? Report a correction with the article URL and original source.