
Polar Vortex and El Niño Winter Weather: Reading the November 2026 Outlook
Read the dated November 2026 El Niño outlook and learn how polar-vortex discussion, seasonal probabilities and local weather forecasts differ.
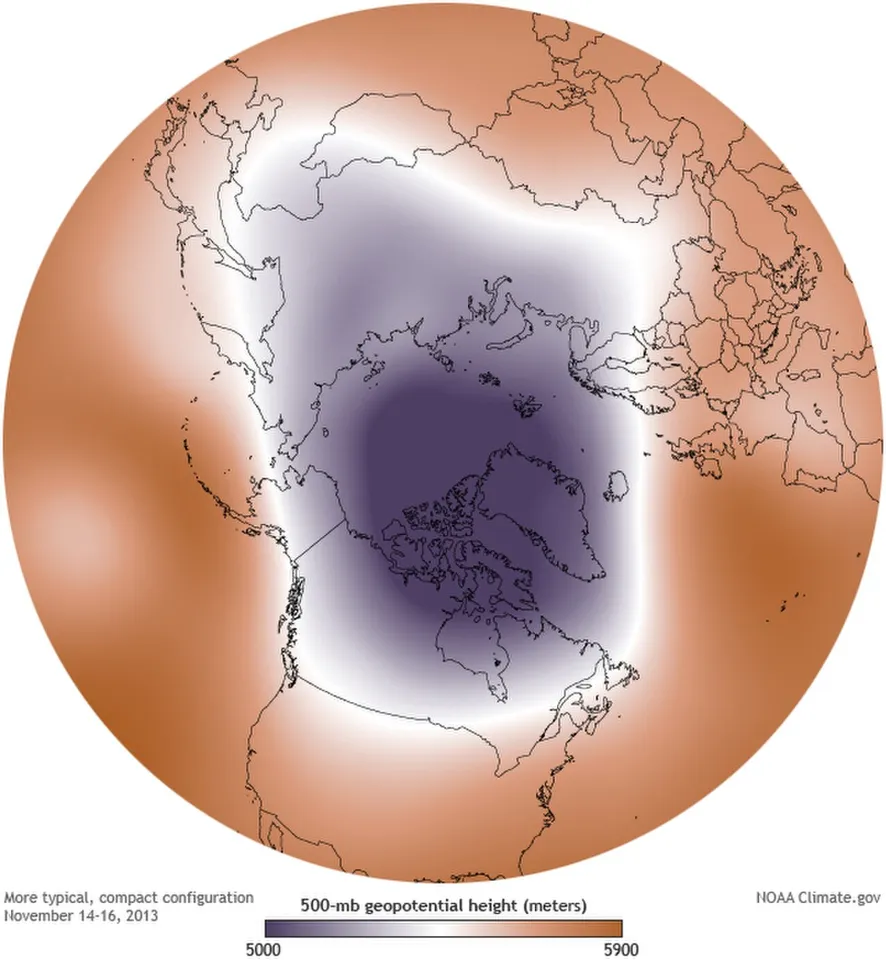
The polar vortex and El Niño are different parts of the climate system. Neither name, by itself, tells you the weather at your address next week. The polar vortex concerns circulation in the atmosphere near the poles; El Niño concerns a coupled ocean-atmosphere pattern in the tropical Pacific. Their influences can interact, but a seasonal pattern is not a local daily forecast.
The Climate Prediction Center's discussion dated 12 November 2026 reports an El Niño advisory and describes a strong-to-very-strong event as likely through January–March 2027. That is a dated outlook statement, not a guarantee of a particular snowstorm. This guide explains how to read the terminology, the time horizon and the uncertainty without turning a scientific discussion into a dramatic forecast it does not support.
What the current discussion actually says
The 12 November CPC discussion says El Niño continued to strengthen and gives a probability greater than 79 percent for strong-to-very-strong conditions through January–March 2027. It also explicitly says that impacts consistent with El Niño are more likely, but not guaranteed. The date belongs beside the statement because the diagnostic page updates over time.
That probability refers to the specified ENSO outlook, not the chance that every US location experiences the same winter conditions. It cannot be copied into a local snow headline without changing its meaning. Identify the event being forecast before repeating the number.
The discussion is a source for the climate outlook, not a real-time warning service for a street or county. For immediate conditions and active warnings, consult the relevant National Weather Service local forecast and alerts. This article does not replace those products or infer an emergency from a broad seasonal indicator.
What is the polar vortex?
The National Weather Service describes the polar vortex as a large area of low pressure and cold air near the poles, with a seasonal cycle. Its public explanation stresses that the feature is not new and is not a weather system sitting at the ground. Headlines sometimes omit those distinctions and make the term sound like an approaching object.
When discussing Northern Hemisphere winter, it is useful to ask which atmospheric level the source means. Stratospheric circulation and weather nearer the surface are connected questions, but they are not identical descriptions of one layer. A statement about winds high in the atmosphere needs further interpretation before it becomes a claim about conditions outside a home.
For a classroom sketch, draw the surface and several atmospheric levels separately. Place the circulation label at the level discussed by the source. The drawing is not a forecast model; it prevents a basic category error in which an upper-air feature is imagined as a storm moving directly along the ground.
What is El Niño?
El Niño is the warm phase of the El Niño–Southern Oscillation system in the tropical Pacific, involving ocean and atmospheric conditions. It is not another name for the polar vortex or for an individual warm day in the United States. The terms identify different phenomena at different geographical scales.
A useful introduction begins with location. Mark the tropical Pacific on a globe, then mark the polar regions. The systems can influence broader circulation through connections studied in climate science, but the map makes clear why the names are not interchangeable. A shared effect on winter discussion does not make their physical origins the same.
Students should also distinguish a measured departure from a reference condition from an absolute temperature. An ocean-temperature anomaly describes a difference relative to a baseline. It does not mean the entire ocean has that temperature or that the same numerical change automatically appears in a city's air temperature.
An anomaly needs a baseline
Imagine a fictional ocean measurement averaging 28 degrees while the relevant reference average is 26.5. The anomaly in this example is positive 1.5 degrees. That calculation concerns a difference between comparable values. It is not the absolute ocean temperature and not a forecast of a 1.5-degree increase everywhere else.
The choice of reference period and geographical region matters. Comparing a value from one region with a baseline from another would answer a different question. A well-labelled chart gives the reader the unit, area and reference information needed to understand the departure.
This is a transferable data skill. In economics, education and science, a number described as “above normal” is incomplete without a definition of normal. Before reacting to a coloured map, find the accompanying legend and explanation. The colour tells you less when the baseline and measurement are missing.
A seasonal outlook is not a daily forecast
A seasonal outlook concerns a longer interval and often describes chances of broader categories. A daily forecast concerns a much shorter period and more specific weather details. Moving a statement from the first category into the second without additional evidence creates a false level of precision.
Consider two fictional winters with the same average temperature. One contains mild days interrupted by a brief sharp cold period; the other stays closer to the average throughout. The seasonal average does not reveal the complete sequence. A warmer-than-reference season can still contain cold days, just as a lower average does not specify the timing of every cold episode.
That example explains why a broad outlook and a later local warning need not contradict each other. They may describe different quantities and time scales. Check the definitions before concluding that one source disproves the other merely because the wording sounds different.
Probability is not a percentage change in temperature
An invented outlook might assign a 45 percent probability to an above-reference category. That does not mean temperatures are expected to rise by 45 percent. One figure describes the chance of a category; the other would describe a change in a measured quantity. They have different meanings even though both use a percent sign.
If the comparison probability were one third, changing it to 45 percent would be an increase of approximately 11.7 percentage points. It would still leave other outcomes possible. A higher probability is not the same as certainty, and a forecast category is not a precise description of every day within it.
For a student worksheet, make separate columns for event, probability, measurement and unit. Put a seasonal category in the event column and temperature in the measurement column. This simple organisation makes it harder to accidentally rewrite a probability as a physical amount.
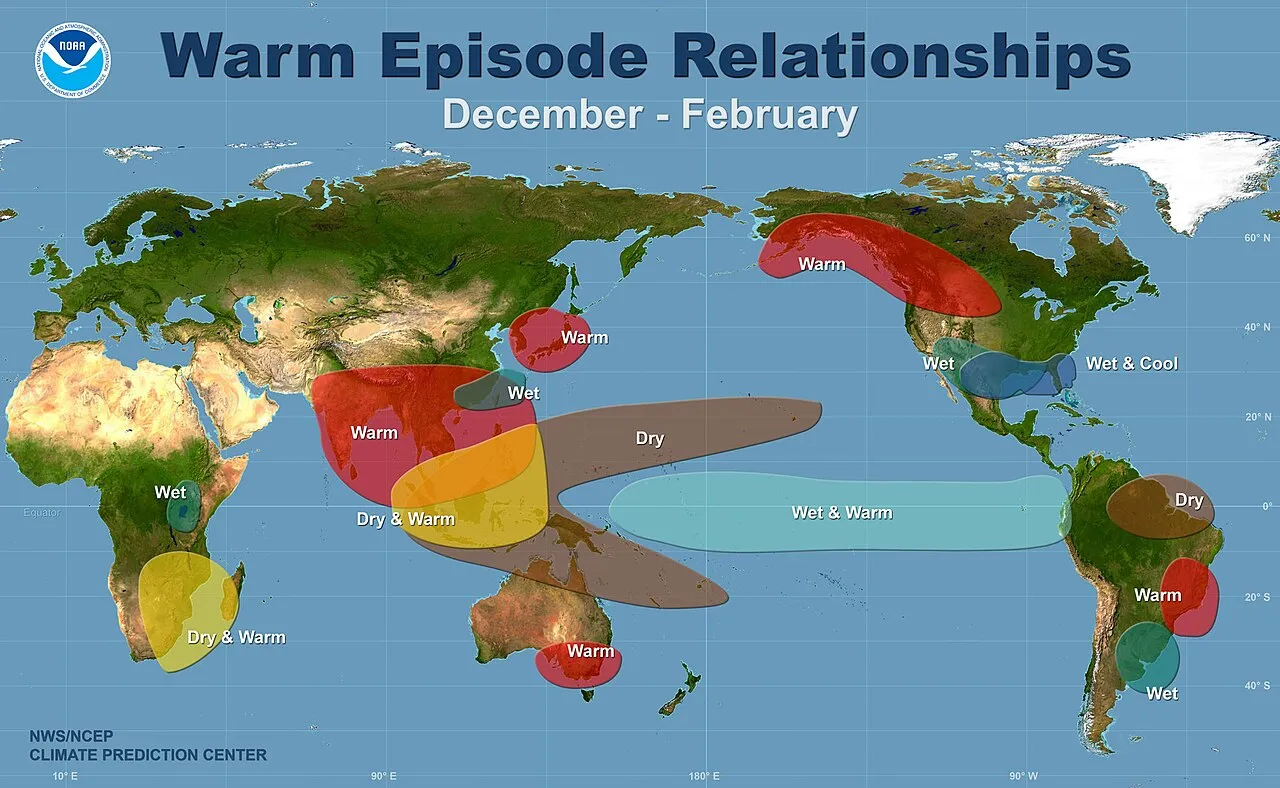
NOAA educational illustration of general El Niño patterns. It is not a local forecast or a map of guaranteed conditions in winter 2026–27.
Why one climate influence does not settle the winter
The atmosphere and ocean form a complex system. A recognised influence can change the likelihood of some patterns while other factors and shorter-term developments still matter. That is why the CPC discussion's qualification about non-guaranteed impacts is important, rather than a sentence to remove from a headline.
Avoid an invented contest in which one climate feature must “defeat” another and determine every outcome. Such language may attract attention, but it can hide the actual scientific question: how the combined state of the system changes probabilities at particular scales and time horizons.
A useful classroom comparison is a sports team whose stronger preparation improves its prospects without guaranteeing every result. The analogy explains probabilistic reasoning, not atmospheric physics. Like every analogy, it has limits; its purpose is to prevent an influence from being mistaken for a complete deterministic prediction.
Read a weather map in the right order
Start with the title, issue date and valid period. Next read the variable and units. Then inspect the legend and geographical coverage. Only after those steps should you interpret the shading over a particular area. A cropped image without those labels can be visually impressive while being difficult to interpret responsibly.
Check whether the map shows observed conditions, a model scenario, an average of forecasts or an official outlook. Those are different products. A model image reposted online should not automatically be described as a confirmed event or a local warning issued by the National Weather Service.
For an original exercise, give students two fictional maps with the same colours but different legends. On one, blue could represent a temperature difference; on another it could represent a probability category. Ask them to explain why identical-looking colours do not establish identical meanings.
Timing and location limit a claim
A national or hemispheric discussion does not supply the same detail as a forecast for a specific town. The size of the area being described affects the conclusion a reader can draw. A statement that a pattern affects North America is not a prediction of the same conditions in every state, altitude and local setting.
The valid interval matters too. A winter outlook cannot identify the exact weather of a school trip on a chosen afternoon. The closer that event becomes, the relevant local forecast products provide a different kind of information. Use the product designed for the question rather than stretching one source beyond its purpose.
When sharing a forecast, keep its issue date and valid period visible. An accurate map from an earlier week can become misleading if circulated as a new prediction. The problem is not necessarily the original forecast; it can be the loss of context during reposting.
Build a small climate-literacy notebook
Choose one official outlook and record its date, area, period and variable. Write a short summary that preserves the probabilities and qualifications. Keep a separate section for questions you cannot answer from that product. An unanswered local question should not be filled with a guess merely to make the notebook look complete.
Later, compare the appropriate observations with the original question and period. Do not select only one dramatic day and use it to judge a forecast about a seasonal average. Evaluation should compare like with like, with the relevant definitions preserved.
For a group exercise, have students exchange summaries before seeing each other's conclusions. Can another reader identify the same source, date and scope from the note? If not, improve the labels. Reproducible interpretation is a worthwhile scientific result even when the project does not create a new forecast.
What to do with dramatic winter headlines
Find the underlying official discussion and check whether the headline's certainty matches it. Words such as “will,” “could” and “more likely” are not interchangeable. A responsible explanation should not turn a conditional possibility into an unavoidable outcome just because stronger wording sounds more exciting.
Also check whether a photo documents the event discussed. An archive snow scene may illustrate winter, but it does not prove a predicted storm has already happened. A circulation diagram is explanatory material, not a photograph of an invisible feature. Captions should identify those roles plainly.
Further science reading is available through the RayTech educational guides. The goal is to make students more capable of interpreting public weather information, not to replace professional forecasting. Understanding probability, scale and source dates helps readers ask better questions when the next dramatic headline appears.
Common questions
Are El Niño and the polar vortex the same thing?
No. El Niño concerns the tropical Pacific ocean-atmosphere system, while the polar vortex refers to atmospheric circulation near the poles. Their influences can be discussed together without treating them as interchangeable names or assuming one alone determines the weather at a particular address.
Does the November 2026 discussion guarantee a snowstorm?
No local storm guarantee follows from the cited ENSO discussion. Its outlook concerns the specified climate pattern and period, and the source explicitly notes that expected impacts are not guaranteed. Immediate local conditions and warnings require the appropriate current forecast products.
Can a generally warmer winter still have a cold period?
A longer-period average does not describe every day. A short cold episode and a warmer seasonal average can coexist without mathematical contradiction. Compare the same location, period and measurement before using one observation to reject a broader statement.
Where should I check current information?
Use the latest official CPC discussion for its climate scope and the National Weather Service for relevant local forecasts and alerts. This article records the discussion checked on 12 November 2026. A rolling source page may contain a later update when you return, so keep dates attached to quoted information.
Sources
- National Weather Service explanation of the polar vortex
- Climate Prediction Center ENSO diagnostic discussion, checked 12 November 2026
- NOAA discussion of the polar vortex and ENSO relationship
Image credits: cover: National Oceanic and Atmospheric Administration - Pacific Marine Environmental Laboratory, source, Public domain. Resized and converted to WebP. inline: NOAA NWS/NCEP Climate Prediction Center, source, Public domain. Resized and converted to WebP.
Found an error or an outdated detail? Report a correction with the article URL and original source.