
Sensex Explained: Index Points, Percentages and Market Reading
Understand Sensex levels, point and percentage changes, free-float weighting and quote timestamps without confusing an index with a share price.

The Sensex is a stock-market index associated with BSE. Its purpose is to represent the performance of a defined group of companies using an index methodology. The number displayed in a market update is an index level, not the rupee price of one company and not a direct measurement of every household's financial position.
This guide explains index points, percentage changes, constituents and free-float weighting for students reading Indian market news. It does not provide a live quote, recommend a trade or claim that a move will continue. The source information was checked on 5 November 2026; current prices and official market status should be checked with the exchange.
What does the Sensex represent?
The Sensex tracks a selected group of major companies under BSE Indices' published methodology. The commonly described thirty-company benchmark is a defined index, not a count of all businesses in India. Its composition and calculation follow rules rather than a simple vote about which companies are most popular.
That scope matters when interpreting a headline. The benchmark can rise while some individual shares fall. A company outside the index can have a very different trading day. An index summarises its specified basket; it does not guarantee that every investment or business shares the same outcome.
Use the official index information for current constituents and methodology. A list copied from an old article can become outdated after changes. A correct explanation of the general method should not be paired with an unverified claim that every past constituent remains in the basket today.
Is an index level a share price?
No. A share price is the quoted price of a particular security in a specified market and currency. An index level is the output of an index calculation. The two can appear beside each other in a market application while representing different kinds of numbers.
For example, a fictional share priced at one hundred rupees is not the same thing as an imaginary index at ten thousand points. Comparing the bare numbers tells you nothing useful about which is cheaper or better. Their definitions and units differ.
Before using a figure, name the instrument and field. Is it a share's last traded price, the benchmark's level, a day's change or a percentage? Reading the label prevents a large amount of confusion without requiring advanced financial mathematics.
Points and percentages are different ways to describe change
An index-point change is the difference between two index levels. A percentage change expresses that difference relative to the reference level. A large point move can represent a different percentage depending on the starting value.
In an imaginary example, an index rises from 10,000 to 10,200. The point increase is 200. Divide 200 by 10,000 and multiply by one hundred to get two percent. These are fictional teaching numbers, not a quotation of the actual Sensex on this article's check date.
Now start at 20,000 and add the same 200 points. The percentage increase is one percent. The exercise explains why point changes from different periods should not be compared without considering the underlying level.
Which reference price or level is being used?
A market display can compare the current level with the previous close, the opening level or another selected point. Those comparisons answer different questions. Read the platform's label before interpreting the direction or size of the change.
An index can be above its opening level while below the previous close. That is not a contradiction. It means the two reference points differ. A headline that omits the reference can make a normal trading pattern sound mathematically impossible.
For a precise description, include the benchmark, timestamp, current level and stated comparison when verified. If you do not have a reliable current quote, explain the concept without inventing a number. Accuracy is more useful than an unsupported claim to be live.
Why weighting matters
An index does not necessarily give every constituent the same influence. Under a market-capitalisation-related method, a larger eligible company can have a different weight from a smaller one. A move in a high-weight constituent can therefore matter more to the benchmark than an equal percentage move in another company.
This explains how the index can rise even when a simple count shows many constituents falling. Counting rising and falling shares and calculating a weighted index are different operations. Neither should be substituted for the other without acknowledging the change in method.
To investigate a particular market day, use the official weights and relevant price moves. Do not assume which company drove the benchmark simply because its name appeared in a popular headline. A contribution claim requires the calculation or a reliable published analysis.
What does free float mean in this context?
Free-float methodology considers the portion of a company's shares treated as available for public trading under the index rules, rather than simply treating every issued share as equally available. The methodology defines how the relevant factors are applied.
For a simplified illustration, imagine two companies with the same total market capitalisation but different eligible free-float proportions. Their index-relevant values can differ. The example explains the purpose of the adjustment; it is not a complete reproduction of BSE's calculation system.
Read the methodology for the actual treatment of holdings, adjustments and changes. A short explanation is useful for orientation, but it should not be used to manufacture a precise index weight from incomplete company information.
The benchmark is not the whole economy
A stock-market index reflects the market values and composition of its basket. Economic indicators such as employment, output, prices and household income measure different things. A rising benchmark does not prove that every family is financially better off that day.
Likewise, a falling benchmark does not mean every business or activity stopped growing. Markets incorporate expectations and trading conditions as well as company information. Keep the claim proportional to the measure rather than treating one chart as a complete description of a country.
Our Pakistan economy learning guide uses the same principle across different indicators. The country and institutions differ, but a measure's scope still matters. Understand what a statistic represents before asking it to support a larger conclusion.
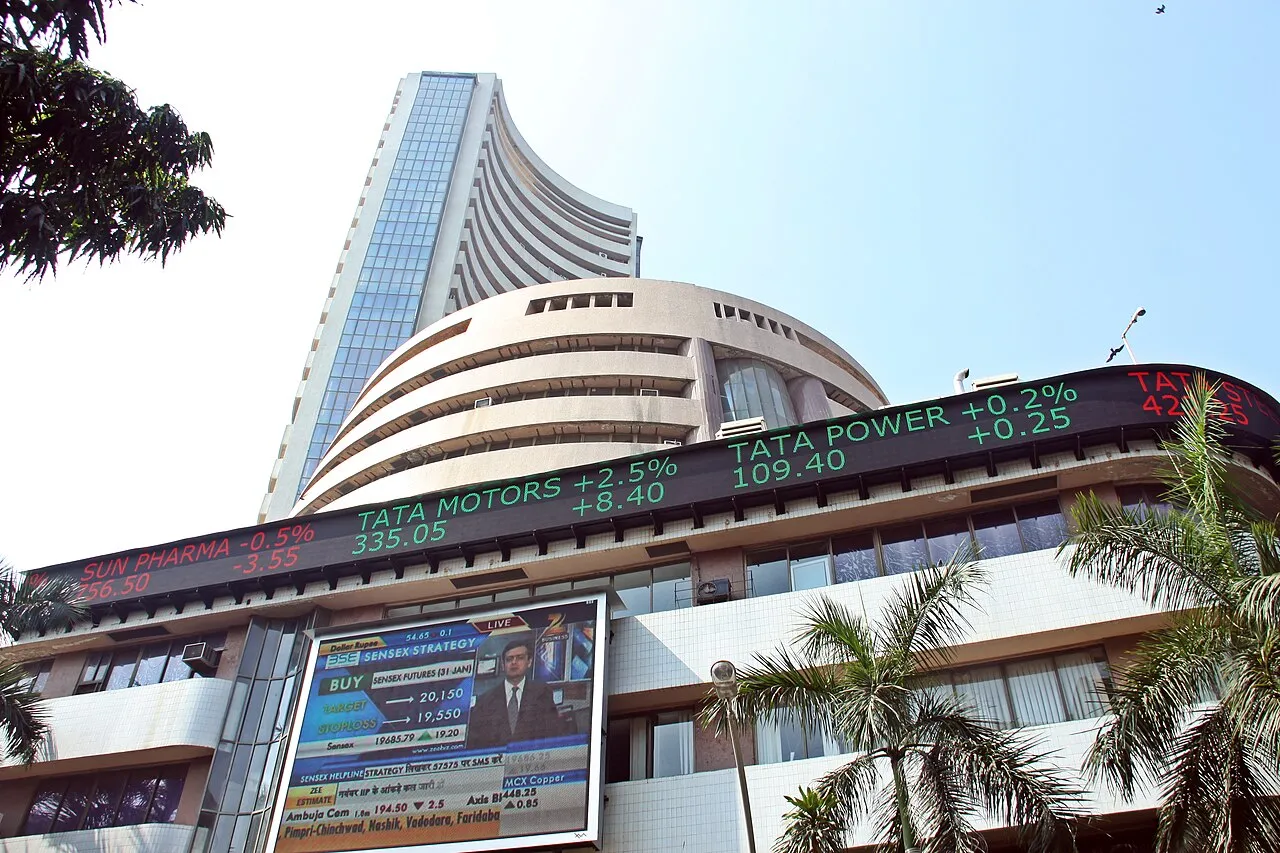
The BSE building at Dalal Street in Mumbai; a contextual photograph rather than a live market chart or current quote.
Sensex and Nifty are separate benchmarks
Market news often mentions Sensex and Nifty together. They are distinct indices with their own specified baskets and methodology. Their levels should not be treated as prices of interchangeable securities or compared as though a larger level automatically means better performance.
To compare movement, use a consistent period and an appropriate return measure. Comparing one index's morning level with another's previous-week closing level does not establish which performed better over the same interval.
Identify whether a story discusses a cash-market benchmark, a futures contract or another product linked to an index. Related instruments can appear under similar names while having different trading arrangements. A familiar keyword does not remove the need to read the exact product label.
A price index and a total-return measure differ
An index family can include different versions. A price-based measure and a total-return measure can treat distributions differently. Check the exact series before comparing a chart or a fund's performance with a benchmark.
A historical comparison becomes misleading when one side includes a component that the other omits. The calculation period, currency and treatment of distributions all matter. An attractive percentage without those definitions is incomplete information.
This guide does not calculate a current investment return. It explains why the name of the measure belongs beside the number. When using a published return, retain the source's definition rather than shortening it until an important distinction disappears.
Read market hours and timestamps carefully
A figure may be a delayed quote, a live observation, a closing value or a value from a previous trading day. The timestamp and market-status label help distinguish them. A page being opened today does not automatically make every number on it a current trade.
Holiday or special-session arrangements should be checked through the exchange's official notices. Do not infer a trading schedule solely from a general public-holiday article or assume that an annual event always uses the same hours.
For a student report, write down when the source was checked and what status it displayed. This small record makes a later comparison more meaningful. Without it, two different values can appear to conflict even when they were simply recorded at different times.
Avoid unsupported explanations for a daily move
A headline may associate an index rise with earnings, global markets or another event. That can be a reasonable analysis, but a single observed coincidence does not establish the entire cause. Several factors can operate at once.
Separate the verified movement from the proposed explanation. If the movement itself has not been checked against a reliable quote, the discussion begins on uncertain ground. If a causal explanation is an analyst's assessment, identify it as such rather than presenting it as a measurement made by the exchange.
Do not invent a current reason merely because the query asks why the market is up today. A clear guide can explain which evidence to inspect without pretending to have observed a trading session it has not verified.
A benchmark does not remove investment risk
An index summarises a market basket; a product linked to it still has its own terms, costs and risks. A familiar benchmark name is not a guarantee of a particular future return. This page does not advise buying or selling a security.
Read official product disclosures and use appropriate regulated guidance for a personal financial decision. Be cautious with promises of guaranteed profits, urgent private tips or requests to transfer money to an individual's account to access a supposed market opportunity.
Never share a broker password, OTP or remote access with someone offering to act on a market tip. The existence of a genuine exchange or index does not authenticate every person who uses its name in a message.
A worksheet for reading one market update
Create columns for the instrument, field, timestamp, reference point and source. Enter the information from a single verified update. If a field is missing, mark it as missing rather than filling it with a plausible-looking assumption.
Now calculate a percentage change using clearly fictional levels. Check that the denominator is the intended reference level, not the new level by accident. This simple exercise makes later explanations of point movements easier to assess.
Finally, write a sentence that stays within the evidence. An index rising over a stated interval is a narrower claim than every Indian company becoming more valuable. Learning to preserve that distinction is more valuable than memorising one day's headline number.
Questions readers are asking
A useful final check is to remove the headline and read only the instrument, period and units. If the claim no longer makes sense without a dramatic adjective, rewrite it around the actual measurement. Clear labels make a market explanation easier to assess without turning it into a trading recommendation.
Does a 200-point rise always mean the same percentage?
No. The percentage depends on the reference level. The same point change is a larger percentage of a smaller starting level. State both the point change and its basis before comparing movements across periods.
Can every constituent fall while the benchmark rises?
Under an ordinary positive-weight price calculation, that description would require careful checking rather than a casual explanation. More commonly, some shares rise and others fall, and their weights differ. Verify the actual basket, adjustments and period before making an absolute claim.
Is the index level a price I pay for one share?
No. It is the output of an index calculation. A particular share or index-linked product has its own quoted price and terms. Do not treat the benchmark's number as a universal purchase price.
Does this page provide today's live Sensex quote?
No. It explains how to read a quote accurately. Use the exchange's current information for a live or closing figure, retaining the timestamp and market status. A fabricated current number would make the guide less useful, not more complete.
Sources
- BSE Indices official methodology
- BSE official exchange website
- SEBI investor information
- NSE explanation of free-float factors for comparison
Image credits: cover: Appaiah, source, CC BY-SA 2.0. Resized and converted to WebP. inline: BSEINDIA, source, CC BY-SA 3.0. Resized and converted to WebP.
Found an error or an outdated detail? Report a correction with the article URL and original source.