
Serie A 2026/27: Format, Fixtures and League Tables Explained
Understand Serie A’s 20-team, 38-matchday schedule and learn points, goal difference, games in hand and fixture checks through clear original exercises.

Serie A's 2026/27 schedule contains twenty teams, thirty-eight matchdays and 380 matches, according to the league's official fixture-list introduction. Those numbers fit together: each club faces nineteen opponents twice. Understanding that structure makes the calendar, a league table and the phrase “game in hand” much easier to read.
This guide was checked on 2 November 2026. It explains the competition's published schedule structure and offers original mathematics and data exercises. It is not a live standings service, a guaranteed fixture calendar or a forecast of the champion. Any invented teams and totals below are labelled as teaching examples rather than current Serie A records.
How is the Serie A season organised?
The published 2026/27 framework has twenty clubs and thirty-eight matchdays. Each club has nineteen different opponents and plays each twice, once at home and once away. That produces thirty-eight league fixtures per club. The full competition has 380 matches because every fixture belongs to two clubs' individual schedules.
The distinction between a club schedule and a competition schedule is important. Multiplying twenty clubs by thirty-eight gives 760 team appearances in fixtures, not 760 separate matches. Divide by two because a single match appears once in each participating club's list. The resulting 380 matches agrees with the official league total.
You can model the same idea with a small invented four-team league. Each club plays three opponents twice, producing six fixtures per club. Four times six gives twenty-four team appearances; dividing by two gives twelve actual matches. A smaller example makes the double-counting visible before you apply the formula to twenty clubs.
This is an example of a general counting principle: decide what one item represents before adding items. A team appearance, a match and a matchday are related but different units. A correct multiplication with the wrong unit label can double the apparent size of a competition without anyone making an arithmetic mistake.
Why does a matchday usually contain ten fixtures?
Twenty teams can be paired into ten matches when every club plays once in the round. Across thirty-eight such rounds, ten times thirty-eight gives 380. A matchday is an organisational round, however, and does not require every match to start on the same calendar day or at the same hour.
That last distinction helps explain a crowded weekend fixture list. A round can be spread over several dates for scheduling reasons. A page may still call all those fixtures matchday ten. Do not assume a game is assigned to the wrong round merely because its calendar date differs from another match in the same set.
An original calendar activity is to give ten fictional fixtures the same round identifier but different start times. Sort once by round and once by date. Both views can be useful. The first groups the sporting schedule; the second helps a viewer plan when to watch. Neither field should be forced to replace the other.
If a game is postponed, keep its matchday label and update its actual appointment when confirmed. Moving the date does not necessarily move the fixture into a different sporting round. A clear calendar separates round, planned time and confirmed time so that an update does not erase the meaning of the original schedule.
What do the basic table columns mean?
A league table commonly separates matches played, wins, draws, losses, goals for, goals against, goal difference and points. Read the labels before interpreting abbreviations, especially when switching between languages or providers. A compact table becomes much less mysterious once every number has a named quantity attached.
Start with a fictional row: played ten, won six, drawn two and lost two. Six plus two plus two equals ten, so the outcome columns reconcile with appearances. If the sum were eleven, you would investigate the input rather than simply display a confident total. A simple consistency check can reveal a copied or duplicated result.
Under a three-point win and one-point draw scoring exercise, that row gives twenty points: six times three plus two. Losses contribute no points in that model. The calculation shows why a team with fewer wins can still have a comparable total if the distribution of draws differs. Count the complete record, not just one column.
Always check whether a real table includes penalties, adjustments or other competition decisions before declaring its arithmetic wrong. The basic formula is a useful starting point, but a published points total can reflect information outside the simple win-draw-loss columns. The competition's official record is the place to investigate a genuine discrepancy.
How is goal difference calculated?
Goal difference subtracts goals conceded from goals scored. In a fictional example, eighteen for and twelve against produces plus six. It is not the total goals in the team's matches, which would be thirty, nor the margin from only the latest fixture. The period and competition covered by the totals must remain visible.
A useful comparison uses two invented teams with the same goal difference. Team A has twenty for and ten against; Team B has twelve for and two against. Both show plus ten, but their scoring and conceding profiles differ. A single summary number cannot preserve every feature of the underlying record.
This is why a well-designed table retains goals for and against rather than replacing both with goal difference. The extra columns allow a reader to ask a more specific question. They still do not prove the cause of a team's results. A table describes outcomes; analysing chance creation or defensive organisation requires more evidence.
For a spreadsheet exercise, change one fictional 1–0 win into a 3–2 win. The points and goal-difference contribution remain the same, but both goal totals increase. Watching those fields react helps you understand what each measures. It is more memorable than learning the subtraction formula without testing what the formula hides.
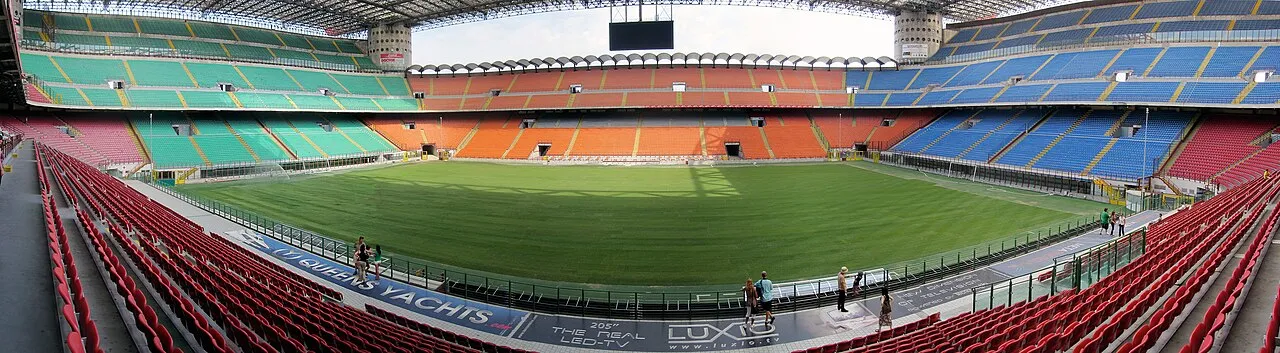
San Siro in 2011. Historical Italian stadium context, not evidence of a 2026 match, current capacity or future venue arrangements.
What is a game in hand?
The phrase means one team has played fewer league fixtures than another reference team. It does not mean the unplayed match has already been won or that three points should be added automatically. The remaining fixture is an opportunity for several possible outcomes, not points already secured.
Suppose fictional Team A has twenty points from ten games and Team B has eighteen from nine. B has one game in hand relative to A. A win in the extra game would take B to twenty-one under the exercise's scoring system, a draw to nineteen and a loss would leave it at eighteen.
This three-outcome comparison is more informative than writing “B is really ahead.” The actual table records completed results. A hypothetical table can explore possibilities, but it should be labelled as such. Keeping them separate prevents a prediction from looking like an official standing.
Points per game can provide another comparison: twenty divided by ten is two, while eighteen divided by nine is also two. Equal averages do not guarantee equal future results or settle the final ranking. They simply describe completed points relative to appearances in the chosen sample. State the denominator before treating the rate as a judgement.
How should you handle teams tied on points?
Consult the current competition regulations and official table rather than assuming one universal tie-break system. Goal difference, head-to-head records and special deciding procedures can have different roles across competitions and circumstances. This introductory guide does not invent a complete 2026/27 tie-break hierarchy from another league's familiar rules.
A classroom sorting exercise can still be useful if you state that it is fictional. Define a simple order such as points first and overall goal difference second, then sort invented rows. Explain that your demonstration rule is not being presented as the full official Serie A regulation. A model is useful when its boundaries are explicit.
The same caution applies to a mid-season display. An official site may show an order among level teams before all relevant head-to-head fixtures are completed. Do not assume the temporary display necessarily predicts how a final tied finish would be resolved. The stage of the season can affect the interpretation of a ranking.
If a real sporting consequence depends on the tie, read the regulation addressing that situation. An article about basic table literacy cannot replace a competition's official decision. Clear educational writing tells a reader where the simple arithmetic ends and the specific rule question begins, rather than hiding that boundary behind a confident shortcut.
Why can an old fixture page still say upcoming?
A schedule display and a completed report may refresh at different times. An upcoming label is not stronger evidence of the outcome than a dated official result once the match has been played. Compare teams, season and venue before deciding which record answers the question you are asking.
Our Udinese–Roma guide uses a completed club report to explain a match that also appeared in scheduled listings. The lesson is to identify the function of each page. A fixture list answers what was arranged; a match report answers what happened. They need not contain the same amount of information.
Keep publication dates and event dates separate in your notes. A report posted the following morning can describe an evening match from the previous date. A search result's crawl date is another field again. Treating all three as the match date can create apparent contradictions where the underlying records actually agree.
For international viewers, preserve the time zone too. A local Italian kick-off and a converted Pakistan time can show different hours while referring to the same event. Time conversion should never change the home team or result. It only changes the calendar representation of the appointment for a particular location.
Build a small league-table project
Use a deliberately fictional six-team competition before attempting a real-data dashboard. Store each completed match once, with home and away goals in separate fields. Derive each team's record from those matches rather than asking a user to type every table column independently. This makes the relationship between results and standings visible.
Add three checks: each match gives two team appearances, total wins equal total losses, and total goals for equal total goals against across the whole league. These checks are appropriate for the simple model and help detect duplicated or missing records. They are observations about your dataset, not proof that a real table has no administrative adjustments.
Then test a draw, a home win and an away win. Confirm that only the relevant rows change and that the sum of played counts increases by two for each new fixture. This is a meaningful programming exercise because you can explain what each update should do before running it.
Our programming courses offer a place to turn the model into a small interactive table. Keep the project clearly labelled as a demonstration until it has a verified data source and appropriate update logic. A static article should not pretend to be a live table simply because its design resembles one.
A practical checklist for the next table you read
Name the competition and season first. Check the update date, matches played and the column definitions. Separate completed points from possible future points, and season goal difference from the latest winning margin. If clubs are tied, follow the competition's actual rules rather than a remembered rule from another country.
Finally, ask whether the page is teaching a concept or publishing current data. Both can be valuable, but they have different maintenance needs. The twenty-team schedule arithmetic can remain useful long after a particular matchday ends. A current table needs current results. Good labels let a reader benefit from each without confusing one for the other.
As a final check, explain why 760 team appearances become 380 matches. If you can identify the two clubs sharing each fixture, you understand the counting principle rather than merely remembering the published total.
Sources
- Lega Serie A: 2026/27 fixture-list introduction, for twenty clubs, thirty-eight matchdays and 380 fixtures.
- Lega Serie A: official Roma schedule, as an example of a competition fixture display. All sample teams, points and table projects in this guide are original fictional exercises.
Image credits: cover: Original photo by Asgaw, cropped by Blackcat, source, CC BY 4.0. Resized and converted to WebP. inline: robin bos, source, CC BY 2.0. Resized and converted to WebP.
Found an error or an outdated detail? Report a correction with the article URL and original source.