
Strait of Hormuz Explained: Geography, Energy Trade and Evidence Checks
Locate the Strait of Hormuz, understand trade-flow units and shipping-cost channels, and distinguish historical analysis from current operational claims.
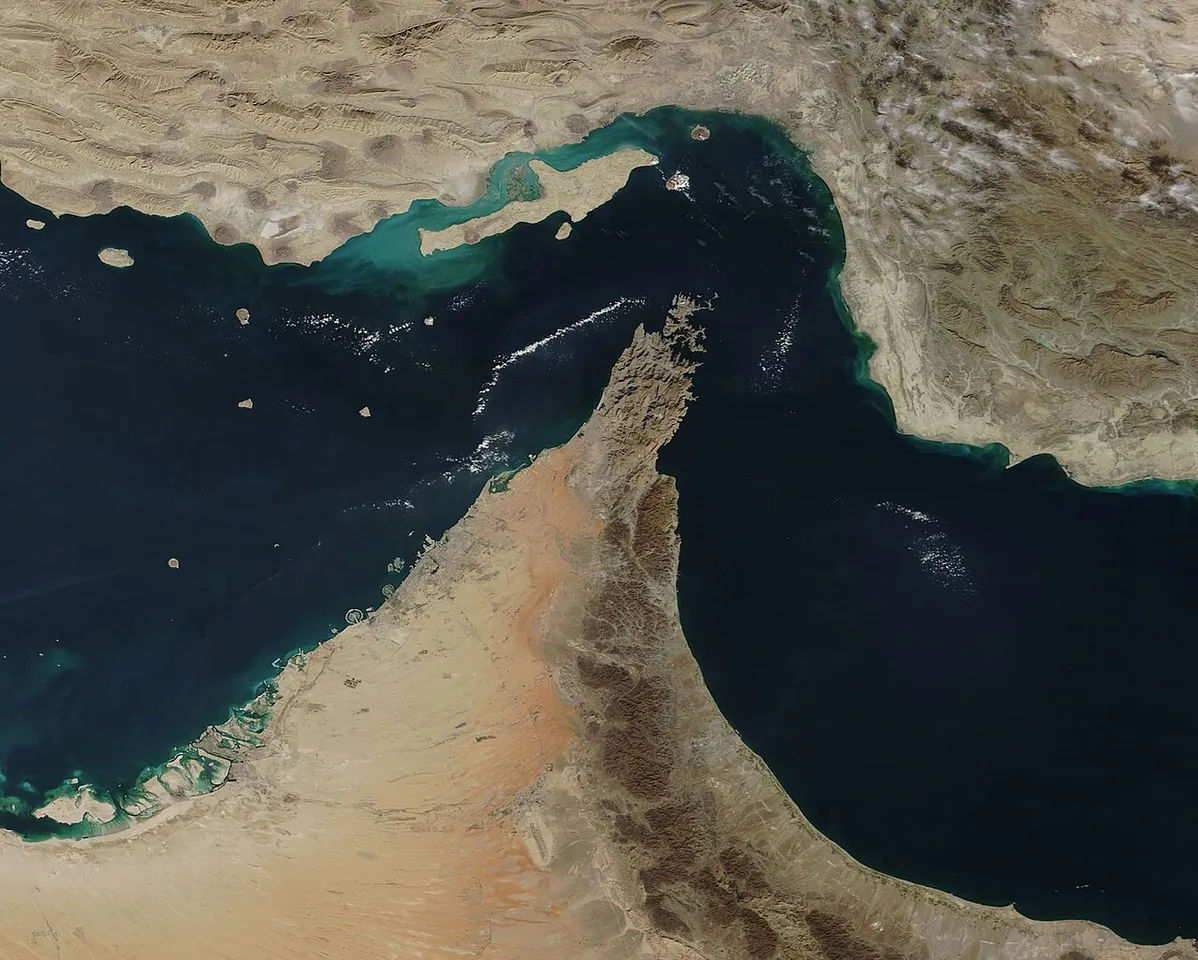
The Strait of Hormuz lies between Oman and Iran and connects the Persian Gulf with the Gulf of Oman and the wider Arabian Sea route. It is an important maritime chokepoint in energy trade. Understanding its significance requires separating geography, shipping activity, economic effects and claims about current conditions.
This educational guide was checked on 5 November 2026 using U.S. Energy Information Administration material. It does not provide live vessel information, confirm that a route is currently open or closed, or offer navigational or legal advice. A dated analysis and a current operational advisory serve different purposes and should not be treated as interchangeable records.
Where is the Strait of Hormuz?
Locate the Persian Gulf, Oman, Iran and the Gulf of Oman on a labelled map. Then follow the geographical connection toward the Arabian Sea. A place name is easier to understand when its neighbouring land and water features are identified rather than memorised as an isolated word in a headline.
For a classroom exercise, draw a simplified regional outline and label the water bodies. State that the drawing is not a navigation chart. A geographical diagram can explain relationships without representing every coastline detail, depth, boundary or operational requirement needed by a vessel.
Keep map orientation and scale visible. A small image on a phone can make a region appear deceptively simple. Before estimating a distance or describing a route, identify the map's purpose and what it actually represents. A decorative illustration should not be used as though it were a precise operational record.
What is a maritime chokepoint?
A chokepoint is a constrained passage on a wider route whose importance comes from the movement depending on it. Its physical size and its economic significance are related but different. A narrow feature can matter well beyond its immediate surroundings when substantial trade or other activity uses that connection.
Use an invented transport network with several roads leading toward one bridge. The bridge's importance depends on which journeys require it and what alternatives exist. The analogy helps explain dependence, but it does not reproduce the full geography, capacity or rules of a maritime route.
Ask what changes if one alternative has limited capacity or serves a different destination. This makes the discussion more useful than simply saying that another route exists. A possible path on a diagram does not establish that it can replace every journey or movement in the original system.
Why is Hormuz important to energy trade?
EIA describes the strait as a major energy-transit chokepoint. To interpret a particular statistic, read the commodity, period, unit and comparison basis. A figure about oil movement in one year is not automatically a measure of all trade, every energy product or current activity on a later date.
Create a table with separate columns for the material being measured, amount, time period and source. A report may discuss crude oil, petroleum products or another category. Keeping those labels prevents a number from being repeated accurately while its meaning changes through an imprecise summary.
Historical analysis is useful for understanding structure and context. It should not be relabelled as a live observation. If a headline presents a familiar old quantity as today's traffic, compare the date and definition with the original source before drawing a conclusion about present conditions.
How do flow and total quantity differ?
A flow expresses an amount per period, while a total quantity concerns an amount over a defined interval. Barrels per day and barrels are therefore different units. A large number without its time basis is incomplete information, even when the digits were copied correctly from a reliable report.
For an invented arithmetic example, a constant flow of two million units per day over five days corresponds to ten million units. The example assumes the flow remains constant and does not describe any actual shipment or current strait traffic. The assumptions matter because real observations need not follow that simplified pattern.
Write the units through every step. This helps students see when a calculation changes from a rate to an accumulated quantity. It also makes a chart easier to interpret because readers can identify whether it describes a daily observation, an average rate or a total across several days.
Why must percentages keep their denominator?
A share of world consumption, a share of maritime trade and a share of a country's imports are different comparisons. The same route can appear in several statistics without those percentages describing an identical quantity. Read the denominator before repeating a claim about its importance.
Use an invented example in which twenty units are compared with totals of one hundred and two hundred. The percentages are twenty and ten percent respectively, even though the numerator did not change. This illustrates why a percentage cannot be interpreted fully without knowing what total it refers to.
When summarising an energy report, preserve the full comparison in words. Avoid shortening a statement to one-fifth of everything unless the source actually defines everything that way. A concise sentence can still retain the commodity, interval and denominator needed to keep the meaning accurate.
How can disruption affect more than the route itself?
Transport problems can affect timing, available shipping capacity, insurance arrangements and commercial decisions. The size and direction of an actual economic effect require evidence. A general connection between transport and costs does not establish a precise change in every country's fuel price or every company's result.
For a fictional supply chain, identify producer, transport, storage and user. Then consider which stage a delay affects and which other stages have alternatives. The exercise shows why an effect can move through a system without implying that every participant experiences an identical outcome at the same time.
Keep the example separate from a real forecast. A diagram can explain possible channels, but it does not supply current quantities, contract terms or policy decisions. An educational explanation should make those missing inputs visible rather than turning a plausible pathway into a guaranteed numerical prediction.
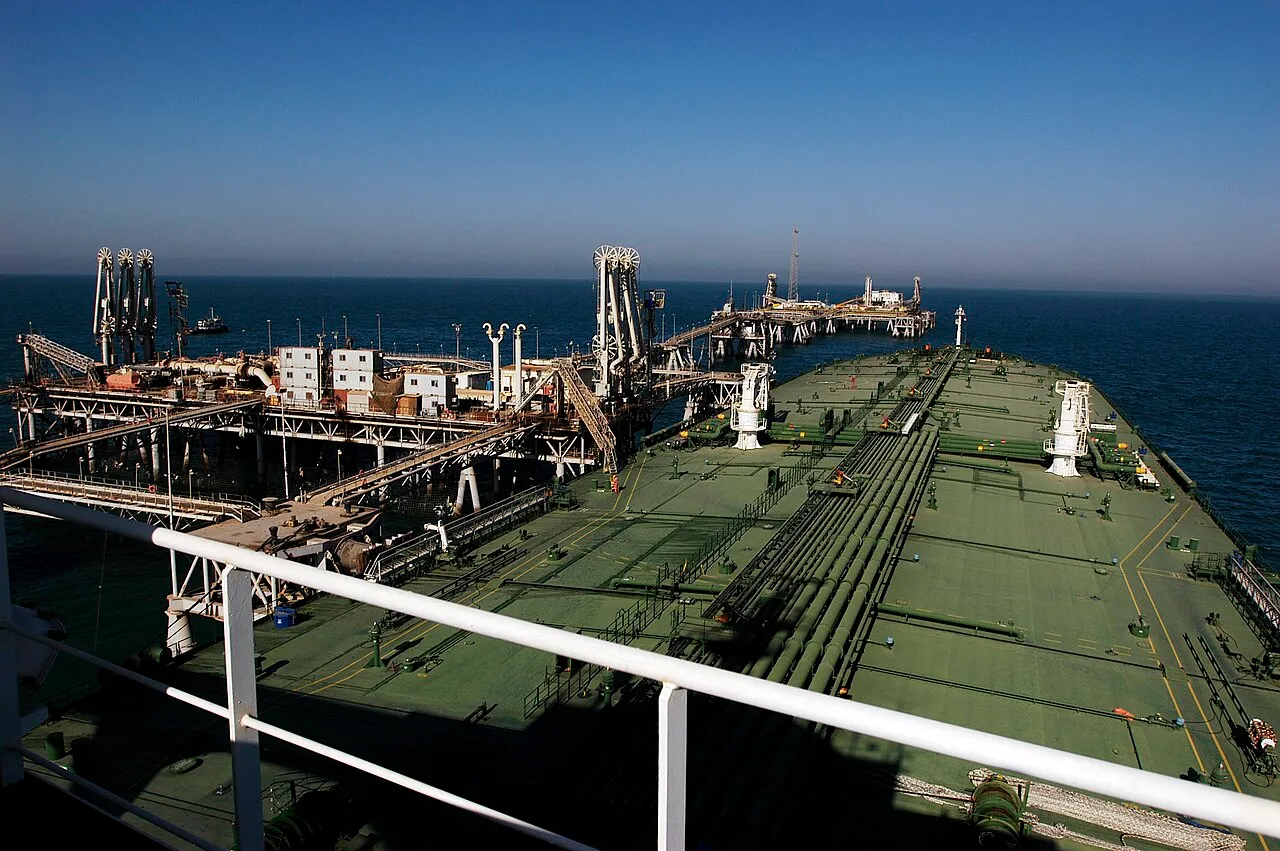
Historical oil loading at Iraq’s Al Basrah terminal in 2005, illustrating the regional energy supply chain rather than current Hormuz traffic.
How are shipping costs different from an oil price?
A commodity price and the cost of transporting it are different records. Insurance, timing and other arrangements can also matter to a commercial transaction. A headline about tanker rates should not automatically be rewritten as though it were a measurement of the same percentage change in a commodity benchmark.
Compare two invented invoices with the same material quantity but different transport assumptions. Identify which line changed and which stayed constant. This helps students understand why a total delivered cost can differ even when one reference price appears unchanged in the simplified exercise.
For real information, use the source appropriate to the quantity. EIA's dated analysis of March 2026 discusses tanker rates and risk conditions during that period. It is useful historical context, but it is not a current navigational advisory or a permanent statement about the route's operational status on 5 November.
Can another route or pipeline replace every movement?
The existence of an alternative does not establish that it serves the same places, commodities or quantities under the same conditions. Read the relevant analysis and its limitations. A line on a map can show a connection without proving that it is a complete practical substitute for every activity using another route.
For a classroom model, give an invented alternative a stated capacity and destination. Then compare it with the original demand. Ask which movements the alternative can serve and what remains unresolved. This develops reasoning about constraints instead of treating the word alternative as a complete solution.
Do not use the exercise to give real vessels routing instructions. Actual navigation involves information and responsibilities outside the scope of a general educational article. The purpose here is to understand system dependence and the evidence required for a claim about replacement capacity.
How do satellite images help geographical understanding?
A satellite image can show land and water features from a particular observation. Its date, processing and scale matter. A visually striking image is not automatically a current record of every vessel, an operational restriction or a legal conclusion about the area it depicts.
Read the caption and source before interpreting the visual. Determine whether it is an observation, a map, a composite or another presentation. An archival image can be excellent teaching material as long as it is labelled honestly and not used to establish an event it does not actually document.
For a project, annotate major geographical features on an appropriate public image and explain the limitations of the annotation. Do not add current-sounding traffic arrows or closure labels without a source establishing those claims. Clear visual presentation should help readers understand evidence rather than conceal its absence.
How should I check a current closure or incident claim?
Identify the issuing source, precise claim, relevant location and time. A historical incident, a commercial decision and an official operational notice are different records. A headline may combine them in a way that is difficult to verify unless the reader follows the original sources and their dates.
Avoid treating an old vessel photograph as proof of a new event. Check whether the visual actually concerns the vessel, place and period described. A genuine image can still be used in a misleading context if its original caption and date are removed.
If the available evidence does not establish present conditions, say so. A general article should not choose between open and closed merely to sound decisive. Keeping uncertainty visible is more useful than converting a familiar historical report into an unsupported claim about a changing situation.
How can students connect geography and economics?
Begin with the physical connection, then identify the activity that depends on it. Add a separate layer for economic quantities such as volume, transport cost or delivery time. Keeping these layers distinct makes the reasoning easier to follow and prevents a map from being mistaken for a complete economic model.
The crude-oil and cost-channel guide provides related learning context. Retain the definitions and assumptions of each example. A connection between geography and prices does not establish a particular market outcome without the relevant current evidence.
For a small project, choose one question such as why units matter in a trade statistic or how a constrained link affects an invented network. Explain the method and limitations. A focused answer is more useful than a large presentation that mixes maps, prices and predictions without showing how they connect.
Why can adding observations double-count the same cargo?
A shipment can be recorded at several points along a journey. Adding every observation does not necessarily count distinct physical quantities. The definition of the statistic must establish whether it measures unique cargo, movements through a particular point or another quantity.
For an invented example, ten units pass point A and later pass point B. The observations do not mean that twenty distinct units were produced. The exercise illustrates why the same physical shipment and several movement records should be kept conceptually separate.
Before combining real tables, check their scope, period and counting method. A neat total can still be misleading if records overlap. Explaining the counting rule is more valuable than producing a large aggregate whose relationship to actual trade is unclear.
Frequently asked questions
Does this page confirm the route's current operational status?
No. It is a geography and information-literacy guide. Present conditions require appropriate current sources and operational information. A dated energy analysis or archival image should not be treated as a live notice simply because it appears in an article checked on 5 November 2026.
Can a historical oil-flow percentage be used as today's figure?
Retain its original period and definition. A historical value can explain context without establishing present activity. Check the commodity, unit and denominator before comparing it with another statistic, and do not replace an unknown current value with an old number merely to complete a table.
What should a beginner learn first?
Start with map labels, units, time periods and the difference between evidence and interpretation. The class resource directory provides available material for related study. A clear explanation of one well-defined quantity is more valuable than repeating a dramatic number whose meaning and date are unclear.
Sources
- EIA: Hormuz geography and historical energy-trade context
- EIA: dated March 2026 tanker-rate analysis
- EIA: historical maritime-route comparisons
Image credits: cover: MODIS Land Rapid Response Team, NASA GSFC, source, Public domain. Resized and converted to WebP. inline: U.S. Navy photo by Photographer's Mate Airman Eben Boothby, source, Public domain. Resized and converted to WebP.
Result dates, fees and eligibility must be checked against the issuing authority's current notice. Report a correction with the article URL and original source.