
TradingView Beginner Guide: Charts, Data and Paper Trading
Learn to read TradingView charts, identify delayed data, use paper trading and keep a practice journal without confusing simulated results with real money.
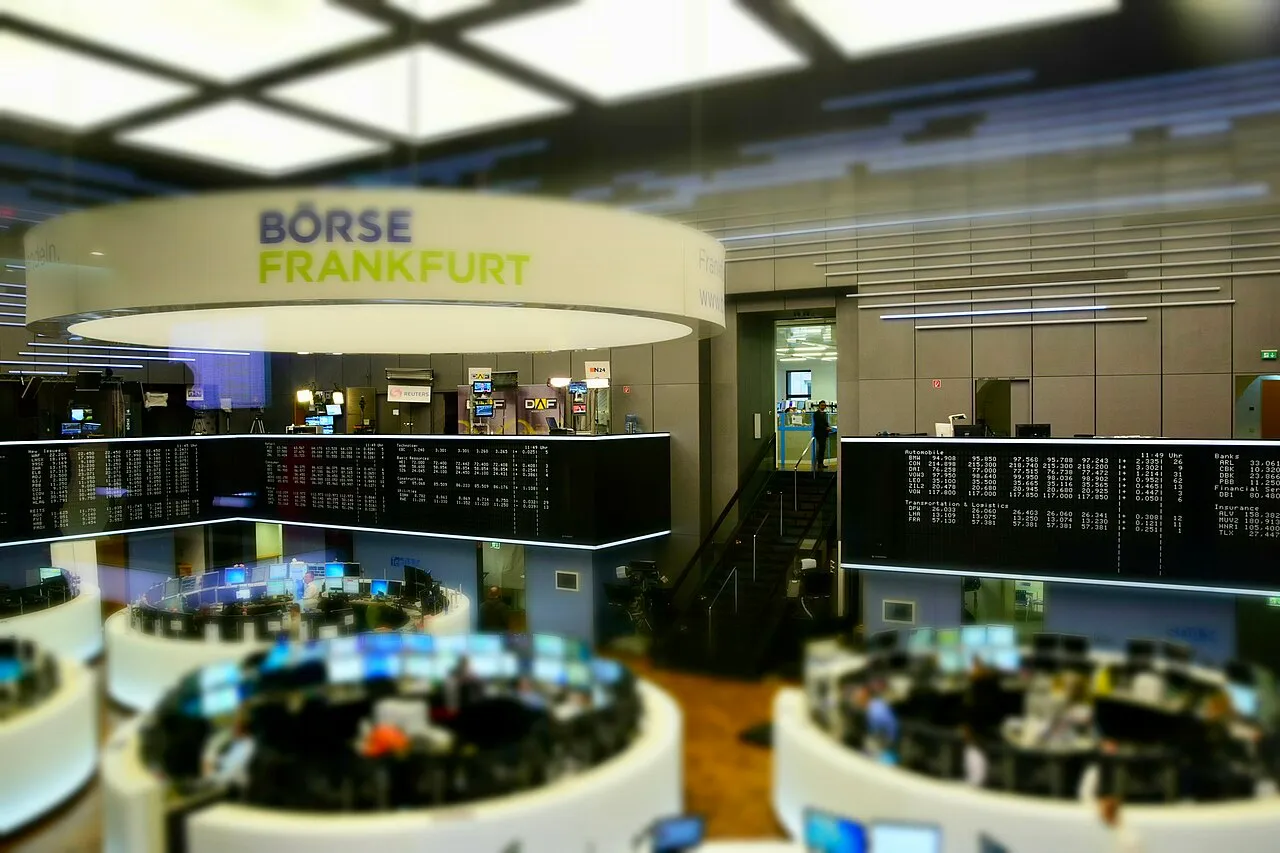
TradingView for beginners: understand the chart before placing an order
TradingView helps people inspect financial charts and practise simulated trades. For a beginner, the useful starting point is not finding a winning signal. It is learning what the selected symbol represents, where its prices come from, how the chart measures time, and whether an order uses simulated or real money.
This guide is a learning exercise for readers in Pakistan and elsewhere, checked against the platform's documentation on 11 November 2026. It does not recommend buying any security, currency or cryptocurrency. All numerical examples below are invented teaching examples, not current prices, forecasts or suggested trades. You can complete the exercises without funding a brokerage account.
The aim is practical: by the end, you should be able to explain a chart in plain English, identify an uncertainty before acting, and keep a useful record of a simulated decision. Those skills are more valuable than collecting colourful indicators whose behaviour you cannot explain.
Start by identifying the instrument and its data source
A familiar name is not enough to identify a financial instrument. Different exchanges, providers and contract types can produce charts that look similar while representing different things. Before studying a price movement, record the full symbol and the exchange or provider shown alongside it.
Create a small worksheet with five fields: instrument name, symbol, provider, quoted currency and chart interval. Leave a field blank if you cannot establish it. A blank is useful evidence that your research is unfinished; filling it with a guess defeats the purpose of the exercise.
Imagine two screenshots labelled with the same company name. One displays a daily chart while the other displays five-minute bars. A large-looking movement in the second screenshot may be a tiny fluctuation inside one bar of the first. Comparing the pictures without checking the interval creates a misleading story even if neither screenshot has been edited.
Also separate the identity of the business from the identity of the instrument. A company share, a derivative linked to that share and a discussion about the company are not interchangeable. If the description contains unfamiliar contract terms, learn those terms before interpreting an order ticket.
Check whether the price information is delayed
Chart access and real-time exchange data are different issues. TradingView documents that some symbols carry delayed data and provides status information for their feeds. Check the symbol's data information rather than assuming that an animated chart, a paid platform plan or a fresh-looking timestamp proves every quote is live.
For a classroom exercise, write down when you inspected the chart and what its data status said. If you compare it with another source, record the second source's timestamp and provider too. A comparison is meaningful only when you know what each number measures.
Suppose an invented chart displays 120 while a separate order screen displays 121. Do not immediately conclude that an application is broken. Possible explanations to investigate include different timestamps, a different instrument, a bid versus a last-traded price, or a different source. This is a diagnostic checklist, not a claim that one explanation always applies.
Delayed information can still be useful for learning chart controls and studying historical patterns. It is unsuitable evidence for a statement that an executable price is available right now. Keep that distinction visible in your notes instead of treating every number on screen as an immediate offer.
Read one candle using four numbers
A candle summarises a period through its open, high, low and close. Consider an invented candle that opens at 100, reaches 108, falls to 97 and closes at 104. Its body connects 100 and 104. Its upper and lower extensions show the extremes outside that body.
Now describe it without forecasting: the closing value is four units above the opening value; the full high-to-low range is eleven units. These are observations. Saying that the next candle must rise is a prediction, and those four numbers alone do not justify it.
The arithmetic makes a good first exercise. Calculate the change from open to close as 104 minus 100, then divide by the opening value to obtain four percent. Next calculate the range as 108 minus 97. Notice that the range and the percentage change answer different questions.
Repeat the exercise with a second invented candle opening at 104 and closing at 101. A lower close does not tell you the exact route price took during the interval. Avoid turning a compact summary into an imagined minute-by-minute account of events you have not observed.
Set a consistent time reference for Pakistan
TradingView distinguishes chart time zones from exchange time zones in its documentation. For your own notes, choose a consistent reference and label it. Pakistan Standard Time is UTC plus five hours; another country's daylight-saving change can alter its difference from Pakistan even when Pakistan's clocks stay unchanged.
Use an invented example to practise the conversion. If an event is explicitly scheduled for 12:00 UTC, that is 17:00 in Pakistan. This conversion does not establish an exchange's opening time or imply that any instrument trades at that hour. An actual market schedule requires the exchange's current calendar, including holidays.
When sharing a screenshot, include the date and time zone in the caption. A statement such as “the move happened at nine” leaves readers guessing whether you mean morning, evening, exchange time or local time. That ambiguity can make two accurate records appear contradictory.
For longer exercises, keep a separate column for the observation time and the candle's period. Looking at an old daily candle today does not make its historical price today's price. Clear labels prevent this simple but surprisingly common mistake.
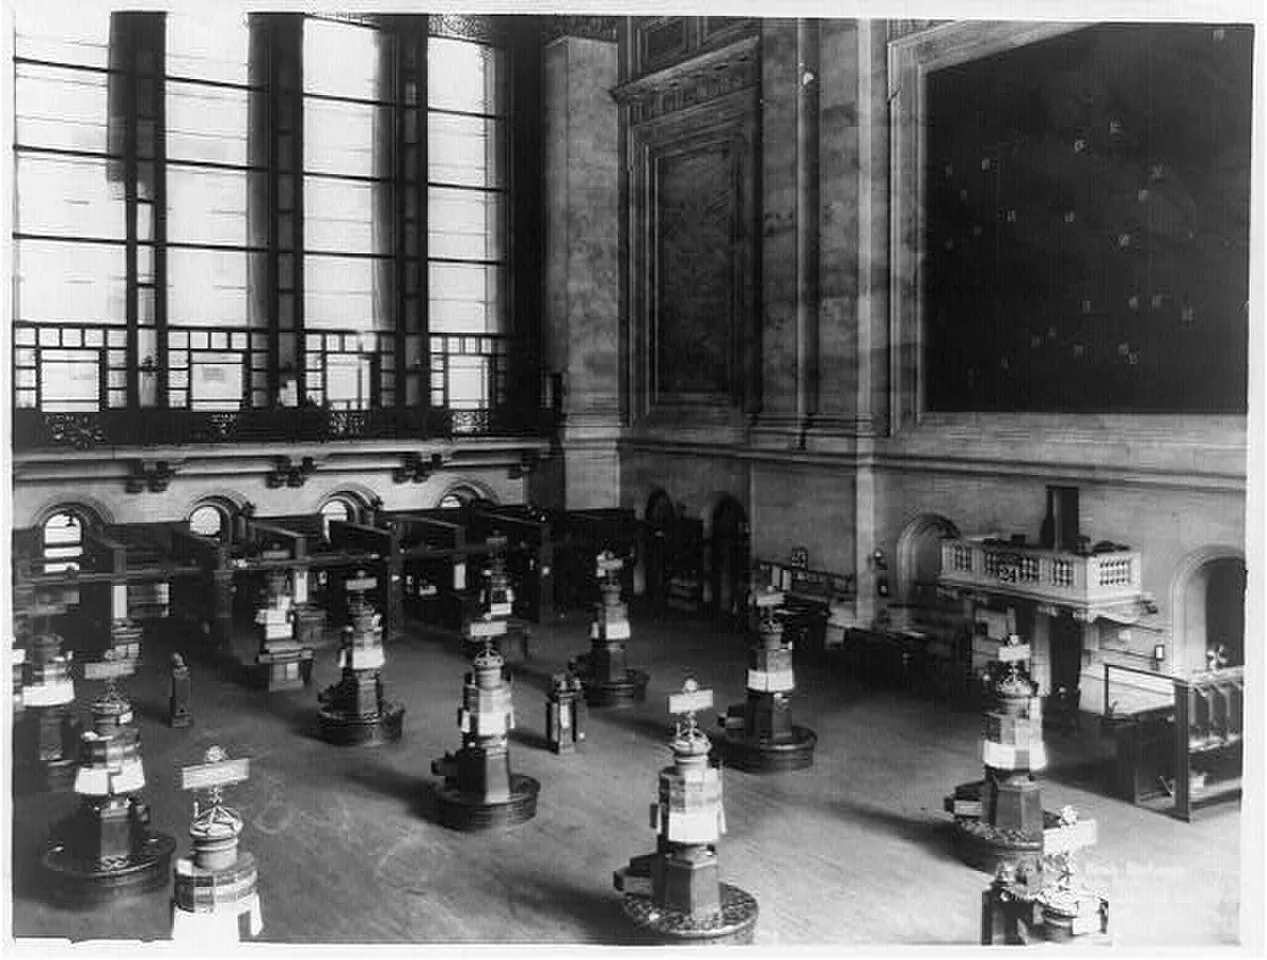
An archival interior photograph of the New York Stock Exchange. It illustrates the history of organised markets, not a TradingView screen or current trading conditions.
Use paper trading as a separate practice environment
TradingView's Paper Trading documentation describes a simulated account that does not require a real-money deposit. Its purpose here is to practise entering, inspecting and reviewing orders. Confirm that the selected account is the simulator before every exercise; a connected brokerage account is a different environment.
Begin with a written question: “Can I enter the quantity I intended and explain what happened?” That is a better first objective than “Can I double the balance?” The first tests a repeatable skill. The second encourages you to judge your understanding from an outcome that might be accidental.
Make a practice log before submitting anything. Include the symbol, simulated direction, quantity, intended order type and reason for the exercise. After submission, compare the record with what the platform actually shows. Record discrepancies instead of changing your original notes to make the result look planned.
If a screen or account label is unclear, stop the exercise and check the official help. You do not need to rush through an unfamiliar ticket to finish a lesson. Correctly identifying uncertainty is itself evidence that you are learning to use the tool carefully.
Understand quantity before experimenting with leverage
Quantity changes the size of a position. In a simplified, invented cash-share example, buying ten units at 100 represents a value of 1,000 before costs. A move from 100 to 102 produces a gross change of twenty across ten units, not two and not two hundred.
Write the units beside every calculation. “Ten shares multiplied by two currency units per share” is easier to audit than an unexplained number. This habit also exposes situations where a contract has a multiplier you have not understood. The simple share example must not be transferred blindly to futures, options or other contracts.
TradingView also supports leverage settings in its paper environment. Its documentation distinguishes that simulation from providing real margin brokerage. Changing a simulator setting does not create a real lending arrangement, prove you qualify for a live product or demonstrate that the same trade would execute in a real account.
For a first session, keep the exercise simple enough that you can explain the quantity and price relationship on paper. Complexity is not a measure of progress. If the arithmetic becomes unclear, reduce the exercise to its basic components before trying another setting.
Compare the intention of different order types
Learn what an order asks the system to do before using its name in a strategy. A market order prioritises execution at available prices. A limit order includes a price condition. Neither description means you can assume an exact future outcome, and a price touching a line in a screenshot is not proof of a particular fill.
Consider a hypothetical learner who sees 100 and writes a limit price of 98. The useful review question is whether the submitted ticket actually contains 98 and the intended quantity. If the order remains open, the learner should inspect its status rather than reporting it as a completed purchase.
Keep open orders and open positions separate in your notes. An instruction waiting to execute is not the same thing as an existing holding. Likewise, cancelling a pending order and closing a position are different actions. Read the confirmation and resulting account state instead of relying on the appearance of a button.
Use the simulator to practise these distinctions with small, clearly labelled examples. Do not copy an unfamiliar order from a social-media screenshot. Without its instrument, account context and conditions, the screenshot is an incomplete instruction rather than a usable lesson.
Review costs, currency and the limits of simulation
A gross result is not the same as a net result. For a teaching example, suppose an imaginary position gains twenty units before costs and the assumed total costs are four. The net figure is sixteen. State that the cost assumption is invented; it is not a quote from a broker.
TradingView provides paper-account settings and documentation for account currency and simulated commission calculations, including per-contract treatment for relevant products. Check the applicable setting rather than borrowing a fee from an unrelated instrument. An account total is only interpretable when its units and assumptions are understood.
Real execution can involve conditions that a practice session does not reproduce fully. These include available liquidity, changing spreads, order handling and personal reactions to an actual loss. A simulated success is therefore evidence about that exercise, not proof that an equivalent live result is obtainable.
If you reset a practice account, retain your earlier log first. Otherwise, it becomes easy to remember the successful attempts and erase the inconvenient ones. An honest record of mistakes makes a stronger learning portfolio than a large demo balance without a history of how it was produced.
Build a short learning journal instead of collecting signals
Use one page per exercise. At the top, write what you intended to learn. Below it, place the chart identification fields, the relevant calculation, the order state and a short reflection. Keep observations separate from interpretations so that another reader can follow the reasoning.
A useful reflection might say: “I confused a pending order with a position, then checked the account status and corrected the label.” That records a specific improvement. “The chart looked strong” does not identify what was measured, what changed or what the learner could repeat next time.
Try reviewing a session without looking at its profit figure first. Can you still identify whether the symbol was correct, the data status was recorded and the quantity matched the plan? If those checks fail, a positive result does not repair the process. If they pass, a negative outcome can still reveal useful information.
For related practice in reading scheduled market information rather than chasing an isolated number, see our Forex Factory calendar guide. A calendar and a chart answer different questions; neither should be treated as an automatic instruction to place a trade.
Questions beginners should be able to answer
Does a paper balance represent money I can withdraw?
No. The paper account is a simulation. An amount displayed there is not a deposit, salary or withdrawable investment return. Before following any instruction to send money to unlock a simulated balance, recognise that the request contradicts the purpose of a practice environment and investigate it independently.
Does a chart subscription guarantee every exchange feed is real time?
Do not assume that it does. Check the chosen symbol's feed information and the current data entitlement. The question is about the specific instrument and source, not simply whether you have an account or can see a moving chart. Record uncertainty if the status remains unclear.
Should beginners add more indicators when a chart is confusing?
Start by removing ambiguity in the symbol, interval, units and time reference. Additional overlays can make an unreadable chart busier without resolving those basic issues. Add a tool only when you can state what it measures and which question you intend to answer with it.
What is a sensible first-session finish line?
Finish when you can identify your chart, explain one candle, calculate an invented quantity example and distinguish a pending simulated order from a position. Save the record of that exercise. That is a concrete learning outcome even if you have made no prediction about tomorrow's market.
Sources
- Paper Trading functionality
- Leverage in the paper environment
- Real-time and delayed symbol information
- Chart and exchange time zones
- Paper-account currency
- Per-contract simulated commissions
Image credits: cover: Ank Kumar, source, CC BY-SA 4.0. Resized and converted to WebP. inline: Unknown author Unknown author, source, Public domain. Resized and converted to WebP.
Found an error or an outdated detail? Report a correction with the article URL and original source.