
Typhoons Explained: Storm Structure, Forecast Maps and Weather Evidence
Understand typhoon structure, wind and rainfall units, forecast-track uncertainty and historical satellite imagery through clearly labelled exercises.
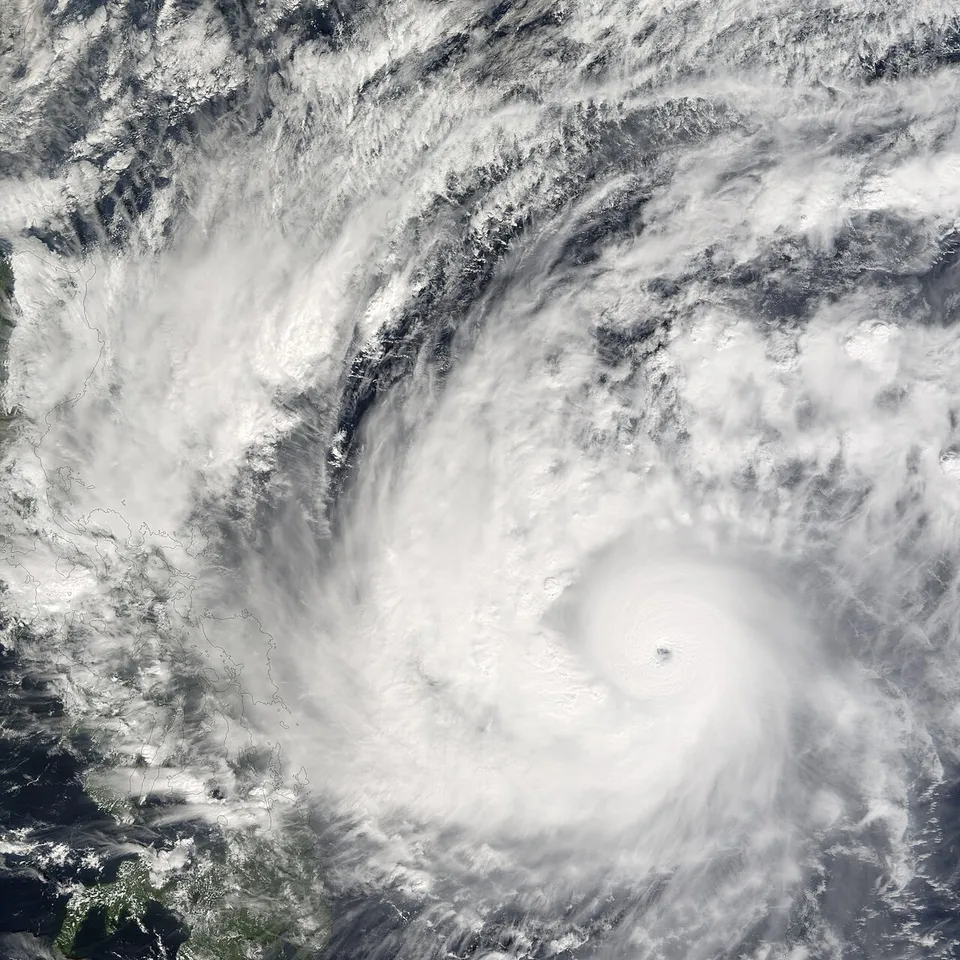
A typhoon is a tropical cyclone in the western North Pacific that has reached the relevant intensity classification. The word describes a weather system, not a guarantee about one country's next storm. Understanding its structure, measurements and forecast products helps readers interpret reports without mistaking an old satellite image or a dramatic headline for a current local warning.
This educational guide was reviewed on 6 November 2026. It explains the science and uses fictional map-reading exercises. It does not name an active storm, issue an evacuation instruction or replace the meteorological and emergency authorities responsible for a location. For an immediate threat, follow current official local warnings rather than this general lesson.
Are typhoons and hurricanes different kinds of storm?
Typhoon and hurricane are regional names used for strong tropical cyclones. The basin and the responsible agency's classification matter when interpreting the label. A storm does not acquire completely different underlying physics simply because a news report uses a different regional name.
NOAA explains the regional naming distinction, while the Japan Meteorological Agency and other regional services publish their own classifications and products. Do not merge different agencies' categories without checking their definitions. Wind averaging periods, thresholds and terminology can affect whether two labels are directly comparable.
For a classroom activity, draw a world map and label the western North Pacific, North Atlantic and North Indian Ocean. Put the appropriate regional terminology beside each basin. The exercise should show that a name contains geographical context; it should not imply that any one basin's warning system automatically applies everywhere else.
What conditions support tropical cyclone development?
Warm ocean water, moisture, an existing disturbance and a favourable atmospheric environment contribute to development. These ingredients are not a simple recipe that guarantees a cyclone whenever the sea is warm. Forecasting also involves the organisation of the disturbance and conditions through the atmosphere.
Use an analogy involving a plant. Water is important, but watering any patch of ground does not guarantee that a particular plant will grow. The analogy is deliberately limited: the atmosphere follows physical processes rather than a gardening rule. Its purpose is to show why one favourable ingredient is not a complete forecast.
A useful research note separates observed conditions from predicted development. A warm-water map is an observation about one variable. A formation outlook is a forecast product with its own time window and definitions. Combining the two without those labels can make a report appear more certain than the evidence supports.
What are the eye, eyewall and rainbands?
A mature tropical cyclone can have a relatively calm central eye, an eyewall surrounding it and spiral rainbands extending outward. The Hong Kong Observatory describes these structural features in its educational material. Not every image shows each feature equally clearly, and storm structure can change over time.
The eye is not evidence that the whole storm is calm. Conditions outside that central region can be very different. A photograph showing a clear centre is therefore an incomplete way to judge the danger to a wider area. Structure needs to be interpreted alongside location, movement and current official information.
For an offline diagram, use three concentric areas and label them carefully. Then add a separate arrow for the storm's movement. Ask students whether the eye's diameter and the distance travelled describe the same measurement. They do not: one concerns structure, while the other concerns a change of position.
Why distinguish sustained wind from gusts?
A sustained-wind estimate and a gust are different measurements. A report should state the quantity, unit, averaging convention where applicable, agency and observation time. A higher gust value should not be silently substituted into a classification based on a differently defined sustained wind.
Invent two records for a classroom exercise: one gives a sustained wind under an explicitly stated convention, and another gives a short gust. Ask which fields must be checked before comparing them. The answer is not simply choose the larger number. The records may describe different events or different measurement definitions.
Unit conversions help only after those definitions match. Converting kilometres per hour into metres per second cannot make a gust equivalent to a sustained observation. Good numeracy includes understanding what was measured, not just performing correct arithmetic on two numbers that should never have been compared directly.
Is a storm's wind speed its movement speed?
Wind speed concerns moving air associated with the system. Forward movement concerns the changing position of the storm's centre. They are not interchangeable. A storm with intense winds can move slowly, and movement can change without an identical change in its maximum-wind estimate.
Consider a fictional centre that travels one hundred and twenty kilometres in six hours along a simplified straight path. Its average movement is twenty kilometres per hour for that interval. This calculation says nothing about the wind circulating within the storm, and it is not a forecast of any real system.
Now change the exercise to a curved path. The distance travelled and straight-line displacement differ. A classroom map can show why the chosen definition matters. Real forecast positions come with uncertainty and timing information, so a line drawn between two points should not be treated as an exact promise of future movement.
What does a forecast track show?
A track describes predicted positions of a storm's centre at specified times. It is not the complete area affected by rain, wind, waves or coastal flooding. A central line can be visually persuasive, but the line alone does not contain all the information needed for a local hazard decision.
Read the product's legend and issuing time before interpreting it. Different agencies publish different graphics. NOAA's National Hurricane Center provides a useful explanation of its own cone product, but that explanation should not be assumed to define every western Pacific forecast map. Consult the agency responsible for the particular product.
In a fictional map exercise, mark a centre at three future times and place a town to the side of the line. Ask whether the town is automatically unaffected. The answer cannot be determined from that line alone. Additional information about the storm and relevant hazard products is required.
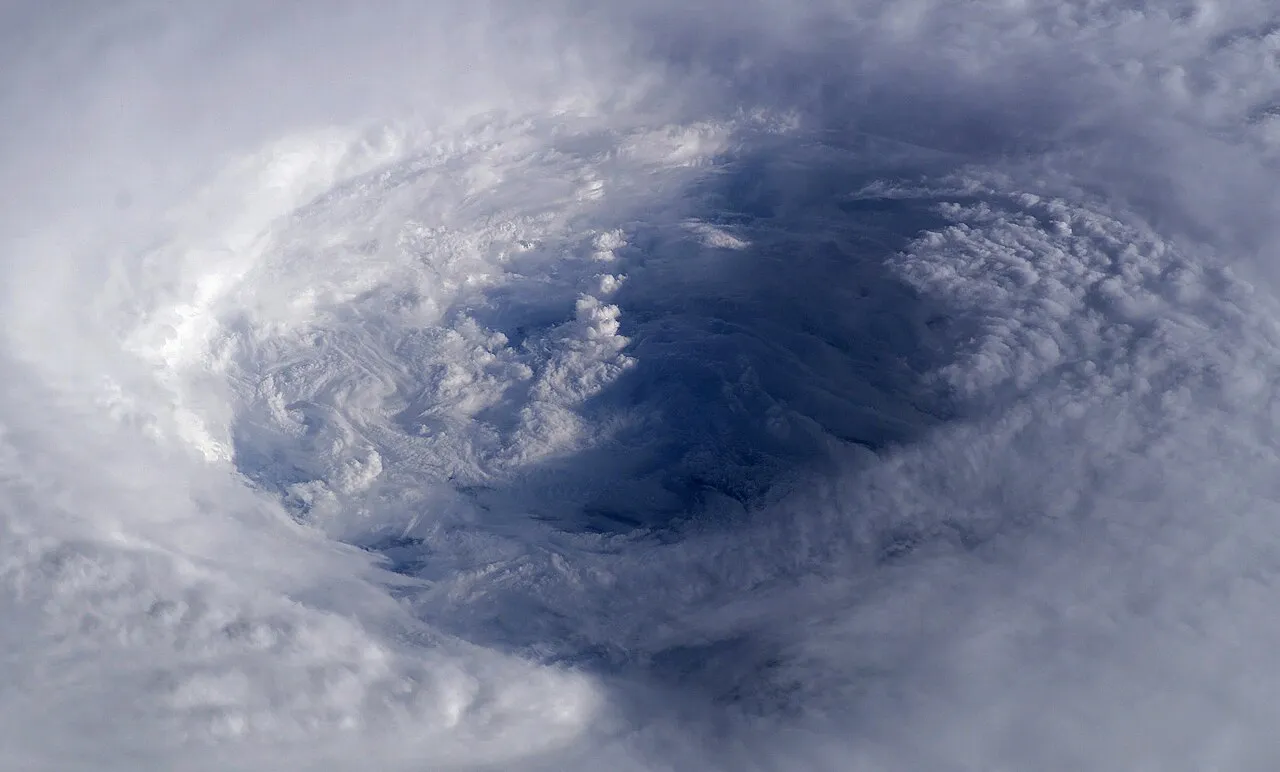
The eye of Hurricane Isabel photographed from the International Space Station in 2003, shown as historical tropical-cyclone structure context.
Why is the forecast cone not the storm's size?
The National Hurricane Center's cone represents uncertainty in the probable track of the centre under that product's design. It does not depict the storm's physical diameter or a boundary beyond which no effects occur. This distinction is essential when learning from screenshots of hurricane forecasts.
Draw a narrow corridor around a fictional track, then draw a separate large circle representing a hypothetical wind field. The two shapes answer different questions. Their boundaries need not match. The exercise explains the conceptual mistake without attempting to reproduce a current official forecast or calculate an actual hazard zone.
Do not interpret the edge of an uncertainty graphic as a safe-versus-dangerous dividing line. A forecast product has a defined purpose, and its limitations belong with its explanation. Decisions about a real location require current local guidance, not a classroom diagram or a general rule invented from one map.
How do rain and coastal flooding add different risks?
Strong wind is only one aspect of a tropical cyclone. Heavy rainfall, flooding, storm surge and dangerous sea conditions can also matter. The importance of each depends on the storm and local circumstances. A wind category should not be treated as a complete measure of every possible impact.
Storm surge concerns abnormal coastal water levels associated with a storm, while rainfall flooding involves different pathways. These effects can interact, but they should not be collapsed into one vague number. A useful educational diagram separates ocean water movement, river flow and rain falling over land.
For a fictional town, identify low-lying coast, an inland river and higher ground on a simple map. Ask which official information each location might need. Do not turn the map into an evacuation plan. Its role is to teach why several hazard products can be necessary to understand one weather event.
How should rainfall units be read?
A rainfall depth needs a location and time interval. Millimetres over one hour and millimetres over one day describe different records. A daily total cannot be compared directly with an hourly rate as though the numbers measure the same duration or imply identical local effects.
Use an invented observation of sixty millimetres accumulated over twelve hours. Dividing gives an average of five millimetres per hour across that period. It does not establish that exactly five fell in every hour. Short bursts could be more intense while other intervals received little rain.
This illustrates a broader statistical habit: an average can conceal variation. To understand flooding in a real place, rainfall alone may also be insufficient; terrain, drainage and previous conditions can matter. A simple arithmetic exercise should never be presented as a complete flood-impact forecast.
Can an impressive satellite image be out of date?
Yes. A satellite image records a particular time and view. Old images can be reposted during a new event because their appearance is striking. Check the timestamp, storm name where supplied, location and originating agency before treating an image as evidence about today's situation.
Historical imagery remains valuable for learning structure. An image showing a clear eye can help explain the eye and eyewall even years later, provided the caption identifies it as historical. The mistake is changing its implied meaning by presenting it as the latest view of another system.
Compare two fictional captions: tropical cyclone structure, historical example and live storm approaching this city. The same pixels cannot support both claims without appropriate evidence. Accurate captions are part of scientific communication, not a decorative extra added after a dramatic picture has been chosen.
How are observations, forecasts and warnings different?
An observation describes measured or estimated conditions at a particular time. A forecast describes anticipated conditions over a stated future period. A warning is an official communication with its own criteria and intended actions. The terms are related, but replacing one with another can change the practical meaning of a report.
Create a three-column classroom chart with one invented example of each. Include the issuing authority and time. Ask students to explain what changed between a measurement, an outlook and an instruction. This helps them recognise why a forecast being uncertain does not mean it has no value.
For real situations, use the current national or regional meteorological service and the relevant local emergency authority. Do not rely on an unsourced forwarded message or wait for a general educational article to update. This lesson is background knowledge and contains no location-specific instruction for an active event.
A map-reading exercise with a worked explanation
Imagine a fictional bulletin issued at noon. It gives three centre positions, a separate rainfall forecast and a clearly labelled uncertainty graphic. A student extracts only the centre line and says every town outside it is safe. Identify the error before attempting any calculation.
The error is using a centre-position forecast as an all-hazards boundary. The correction is to retain the product's purpose, legend and limitations, and consult the separate information relevant to each hazard. A stronger answer also checks whether the bulletin is still current and whether a newer official issue supersedes it.
Now ask a second student to summarise the bulletin without using the words guaranteed or exact. The summary should preserve the forecast interval and uncertainty without becoming vague. This is a communication exercise: accuracy includes both what the evidence supports and what it does not establish.
Questions for checking understanding
Is every tropical cyclone called a typhoon? No. Regional terminology and intensity definitions matter. Explain the basin before using the name, and check the responsible agency's definitions when comparing classifications. Avoid importing one region's category names into another region's warning system without explanation.
Can a lower wind category guarantee less rainfall at one town? No such guarantee follows from the category alone. Different hazards need their own information. Similarly, a calm-looking eye does not establish safe conditions around the storm, and an old satellite image cannot establish its current location.
Where can students continue learning? Use our study resources for geography and science practice or programming courses to build a fictional weather-data table. Label invented data clearly. A well-designed practice activity can improve scientific reading without imitating an official live-warning service.
Sources
- NOAA: hurricane, typhoon and cyclone terminology
- Hong Kong Observatory: typhoon structure
- National Hurricane Center: definition of its forecast cone
- National Hurricane Center: storm surge
- Japan Meteorological Agency: tropical cyclone names
Image credits: cover: NASA image created by Jesse Allen, Earth Observatory, using data obtained from the MODIS Rapid Response team., source, Public domain. Resized and converted to WebP. inline: NASA astronaut Ed Lu, source, Public domain. Resized and converted to WebP.
Result dates, fees and eligibility must be checked against the issuing authority's current notice. Report a correction with the article URL and original source.