
VIX Explained: Implied Volatility, Thirty-Day Expectations and Product Labels
Learn what VIX measures, distinguish implied volatility from direction and realised movement, and interpret horizons, quotes and linked products carefully.
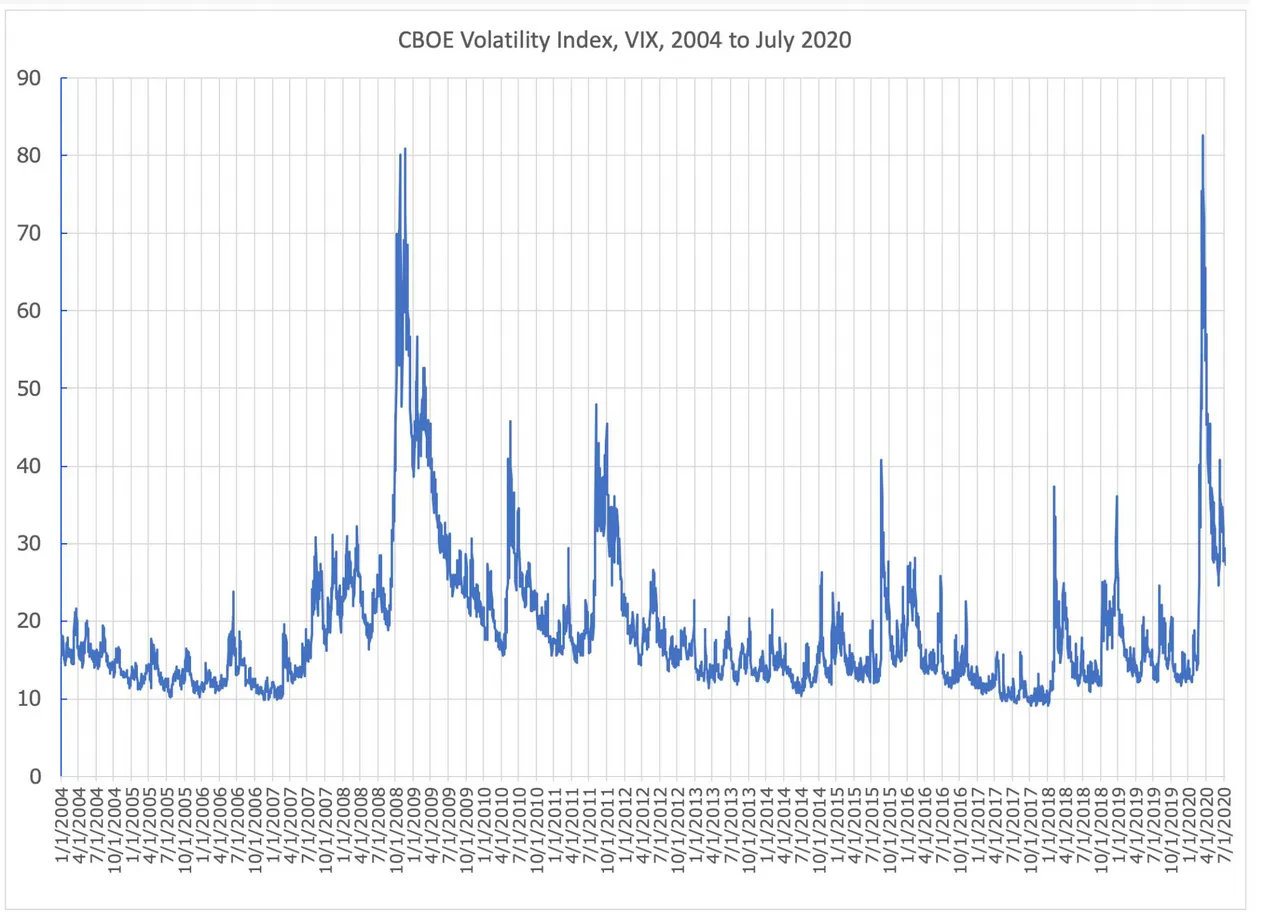
The Cboe Volatility Index, usually called VIX, is a measure of expected volatility associated with the S&P 500, derived from option prices under its methodology. It is not a direct forecast of whether shares will rise or fall. Understanding the index requires separating the expected size of fluctuations, the direction of a market move and the financial products that may reference the measure.
This guide was checked on 5 November 2026 using Cboe methodology and official index explanations. It uses invented values to teach interpretation. It does not provide a live VIX quote, predict a crisis or recommend a trade. Current observations and instrument-specific terms should be checked through appropriate official and market-data records.
What does VIX measure?
The official methodology describes a measure of thirty-day expected volatility of the S&P 500. This concerns an expectation inferred under a defined method, not a record of every future movement. The measurement should not be rewritten as a guarantee about the precise path or final level of the market.
Start by writing expected volatility and price direction in different columns. The first concerns variability, while the second concerns whether a chosen price or index ends higher or lower over an interval. They are related topics but not interchangeable answers to the same question.
For a classroom exercise, draw two invented paths with similar starting and ending values but different amounts of movement in between. The paths show why the final change alone does not describe every aspect of variability. Label the drawing as an illustration, not a calculation of the actual VIX.
How is implied volatility different from realised volatility?
Implied and realised measures concern different information and definitions. An option-price-based expectation is not the same record as fluctuations observed over a historical period. Read the measure, interval and method before comparing two numbers or describing one as an error because it differs from the other.
Imagine a fictional weather analogy in which a forecast is compared with observations collected later. The two records serve different purposes and can differ without being identical kinds of evidence. The analogy helps distinguish expectation from outcome; it does not imply that weather forecasting and option pricing use the same mathematics.
Keep the labels in a project table. Record what information was available when an expectation was formed and which later observations are being compared. This prevents knowledge of a later outcome from being silently treated as though it had been available at the earlier time.
Why is the time horizon important?
Cboe's methodology identifies a thirty-day expectation. That horizon should not be replaced with a vague statement about tomorrow, the whole year or an unlimited period. A financial measure's interval is part of its meaning, not a small detail that can be removed to simplify a headline.
Use an invented timeline with a quote date and the period being discussed. Then compare it with another record whose interval differs. Even if the two numbers look similar, they may not describe the same question. A fair comparison aligns scope and time before interpreting a difference.
When sharing a screenshot, retain its timestamp and the exact measure. A saved display is not a live warning system. It records what a source showed at a particular moment and cannot establish every later market condition merely because it remains available in a message or article.
What does annualised mean in a volatility discussion?
Annualisation expresses a quantity under a stated time convention. It does not mean that the entire quoted percentage is a guaranteed movement during the shorter horizon used by an expectation measure. Read the methodology and avoid substituting an ordinary-language interpretation for the mathematical convention.
For a simplified classroom model using a 365-day year, an invented annualised volatility of twenty percent scaled by the square root of 30 divided by 365 is approximately 5.7 percent. This is an illustration of a particular scaling assumption, not the VIX calculation or a promise that actual returns stay within a fixed boundary.
State the assumptions explicitly. A model-based conversion is useful for learning because it shows the relationship being considered. It becomes misleading when its conditions are hidden or when an illustrative result is presented as a guaranteed range for an actual future market outcome.
Does a higher VIX predict that the market will fall?
A volatility measure does not, by itself, specify the direction of the next movement. Read the actual definition rather than treating a familiar nickname as a complete forecast. Statements about market direction require their own evidence and should not be smuggled into an explanation of expected variability.
Draw two invented sets of returns with large movements in different directions. Ask what they share and what differs. This helps students see why the size of fluctuations and the sign of the final change are separate features that can be described with different quantities.
Avoid turning an association observed in some historical periods into a guarantee. A pattern can be a subject for investigation without determining what happens next. A learning guide should explain the measure and its limitations, not use technical vocabulary to make a trading prediction appear certain.
Why are option prices part of the explanation?
The official VIX description connects the measure to option prices on the S&P 500 under a defined method. This is different from simply counting how many shares fell or taking the previous day's price change. The source information and the calculation determine the quantity being represented.
For a beginner, the key step is to identify that an option is a separate financial instrument with its own terms. A familiar underlying index name does not make an option quote identical to the cash index or explain every condition of the contract.
This article does not teach a strategy for trading options. Its purpose is to show why a measure derived from one kind of market information should not be relabelled as another. Understanding that distinction is useful before encountering more complicated product claims or market commentary.

The Chicago Board of Trade building, shown as broader financial-market context.
Is VIX itself a stock I can buy?
An index is a defined measure. Products referencing it can have different structures, terms and behaviour. A familiar name in a fund or contract title does not remove the need to identify the actual instrument. A product's quote should not be silently substituted for the index level.
For a learning exercise, compare an official index definition with a clearly labelled product document without making a transaction. Identify the reference measure, instrument and period. The exercise distinguishes a calculation from a financial arrangement rather than assuming that every linked product behaves like a directly held share.
Do not infer suitability from the index's popularity. Costs, terms and individual circumstances can matter to a real decision. This guide does not evaluate a particular product or explain leveraged use; it provides the conceptual separation needed to read the relevant documents more carefully.
How are VIX futures different from a current index observation?
A futures contract and a current index reading describe different records. The contract has its own terms and time context. Similar names and numbers do not establish identical behaviour, and a product linked to futures should not automatically be described as a direct copy of the current index at every moment.
Create an invented table with one row for an index observation and another for a contract. Keep their labels and dates separate. If a comparison omits which record is being used, identify it as incomplete rather than choosing the interpretation that produces the most dramatic conclusion.
For actual information, use the appropriate current source and instrument documentation. A general explanation cannot establish an individual's position, entitlement or outcome. The educational task is to recognise the distinction before interpreting a graph, headline or promotional claim.
Why does a percentage change in VIX need careful reading?
A percentage change in an index level and the level's own interpretation are different quantities. A large relative change from a small base can sound dramatic without establishing a particular future market movement. Record the starting value and the measure before discussing the change.
For an invented arithmetic example, a level rising from ten to fifteen increases by five points and fifty percent relative to its starting level. Those numbers describe the change in the example measure. They do not mean that an underlying equity index has moved fifty percent or must do so in the future.
Keep the numerator and base visible in a worksheet. This makes it easier to recognise when a headline has mixed a measure's level, its point change and its percentage change. Accurate arithmetic still requires an accurate explanation of what is being calculated.
How can I read a volatility headline critically?
Identify the source, measure, timestamp and claim. Does the headline report an observation, interpret an expectation or predict an outcome? These are different statements. A graph can support an observed pattern under its definition without proving every explanation attached to it.
Read nicknames as commentary rather than complete technical definitions. A dramatic label can help attract attention while omitting the horizon, inputs and uncertainty needed to understand the measure. Return to the official explanation before repeating a stronger claim about what the number guarantees.
Keep a two-column note of what the source establishes and what remains an interpretation. If the distinction is unclear, preserve the uncertainty. A concise explanation of a limitation is more useful than turning a possible relationship into a universal rule merely to make the article sound decisive.
What makes a useful student exercise?
Choose a narrow question, such as the difference between variability and direction or between a level and its percentage change. Use invented values and label every assumption. A focused exercise helps students understand the quantity rather than memorising a current-looking market number that will soon change.
Ask another learner to reproduce the calculation and explain its meaning. If they can perform the arithmetic but cannot state what the result describes, improve the labels. Numerical accuracy and conceptual understanding are related but different parts of a successful explanation.
The programming courses provide available material for practising tables and arithmetic. For benchmark context, the Dow Jones guide discusses a different measure. Keep their definitions separate instead of assuming that all prominent financial indexes describe the same kind of quantity.
Does an illustrative range establish a maximum loss?
A model-based variability estimate is not a guaranteed boundary for every outcome. Interpreting a range requires the assumptions and distribution used to construct it. The fact that a worksheet produces two endpoints does not establish that actual market observations must remain between them.
For a learning exercise, write the model assumptions beside the range, then list the conclusions the example does not support. Distinguish a mathematical illustration from a promise about an account or a future event. This prevents a useful calculation from acquiring a stronger meaning when repeated without its qualifications.
Keep the lesson focused on interpretation. A volatility number alone does not determine a person's financial exposure or provide a complete risk assessment. Those questions require the actual instrument and circumstances, not merely a familiar index label.
Frequently asked questions
Does VIX guarantee the next thirty days' result?
No. A method-based expectation is not a guarantee of a particular path, endpoint or fixed boundary. Use the official definition and retain its horizon and limitations. The invented calculations in this guide illustrate relationships and should not be copied into a forecast as though they established future market outcomes.
Is a product with VIX in its name identical to the index?
Identify the actual instrument and read its terms. An index, a contract and a fund can have related names while representing different arrangements. The shared label does not establish identical prices, costs or behaviour, and it does not determine suitability for an individual reader.
Does this page provide a live warning or trade signal?
No. It is an educational explanation. For a current observation, use the relevant source with its timestamp. A learning guide should improve understanding of evidence and arithmetic rather than turn an index definition into an unsupported promise about when to buy or sell a financial product.
Sources
- Cboe: VIX products and official information
- Cboe: VIX methodology
- S&P Dow Jones Indices: introduction to VIX
Image credits: cover: McKnight Buchanan, source, CC BY-SA 4.0. Resized and converted to WebP. inline: w_lemay, source, CC BY-SA 2.0. Resized and converted to WebP.
Found an error or an outdated detail? Report a correction with the article URL and original source.