
Hurricanes Explained: Formation, Wind and Water Hazards
Explore Hurricanes Explained with clear explanations, worked examples, source checks and practical questions for independent student learning.
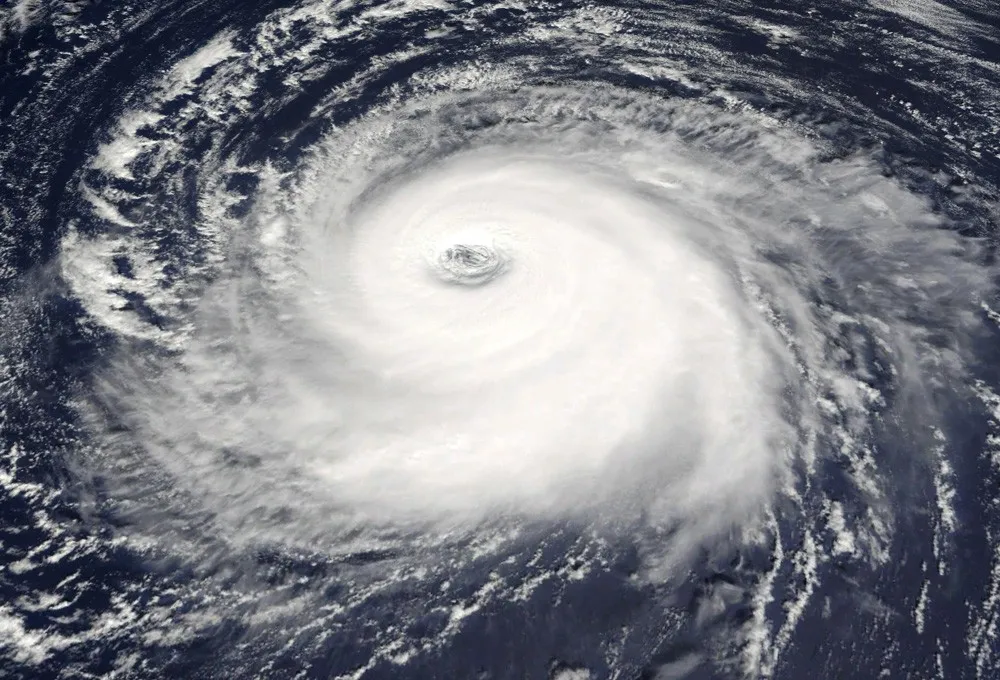
A hurricane is a tropical cyclone classified by sustained wind strength in the Atlantic and parts of the Pacific. NOAA identifies hurricane strength at seventy-four miles per hour or more. The same broad kind of storm is described with other regional names elsewhere. For Pakistan and the northern Indian Ocean, tropical-cyclone information should be read through the relevant official regional authorities, not assumed from an Atlantic headline.
This science guide was checked on 2 November 2026. It is not a current storm forecast, warning or evacuation instruction. Its maps and numerical examples are educational models. For an actual event, use current official meteorological and emergency instructions for the affected location rather than treating a general article as a local assessment.
What is a tropical cyclone?
NOAA describes an organised rotating system of clouds and thunderstorms that develops over tropical or subtropical waters and has a closed low-level circulation. Hurricane is one regional name used when the system reaches the relevant strength. The name is not simply a synonym for any storm with heavy rain or a dramatic satellite image.
A severe thunderstorm, a tropical cyclone and a mid-latitude weather system can all produce hazardous conditions while remaining different kinds of systems. Identify the official classification and region before comparing headlines. Similar-looking cloud patterns in an isolated image do not supply every feature needed for a scientific classification.
For an original classroom activity, sort fictional weather descriptions into “classification supplied” and “insufficient information.” A description containing only heavy rain belongs in the second group for a hurricane-identification question. The exercise teaches what evidence is needed rather than encouraging students to diagnose real storms from a photograph.
Why do warm oceans matter?
NOAA's formation guide explains that warm ocean water and thunderstorm processes provide energy to developing tropical systems. It also identifies other relevant conditions, including a disturbance and relatively low wind shear. Warm water alone is not a guarantee that a hurricane will form, so a single temperature reading cannot settle the question.
The atmosphere and ocean interact as a system. A teaching model can isolate one relationship, but real development involves several conditions and their evolution. Avoid presenting a short “recipe” as a machine that always produces a storm when one threshold is crossed.
For an original diagram, draw separate boxes for ocean conditions, atmospheric organisation and changing winds. Connect them with arrows labelled influences rather than guarantees. The diagram helps learners think about interacting conditions without pretending to calculate a real storm's formation probability.
What does wind shear mean in this context?
Wind shear concerns changes in wind speed or direction between positions or heights. NOAA's formation explanation notes that a large difference around or near a storm can weaken it. That is a physical relationship, not permission to infer a particular system's future from one unlabeled arrow on a map.
Use an original classroom sketch with arrows at two heights. In one version they point in similar directions; in another they differ. Ask what additional measurements would be needed to describe the real atmosphere. A sketch can illustrate a concept while remaining far simpler than a forecast model.
Keep observation and forecast separate. A measured wind field describes conditions at an identified time, while a forecast estimates later conditions. A general guide should not transform a hypothetical diagram into a prediction for Karachi, the Arabian Sea or any other real location.
Why distinguish sustained winds from gusts?
A sustained-wind measure and a brief gust describe different time characteristics. A headline number needs its measurement definition, unit and source. Do not compare a peak gust directly with a sustained-wind classification as though the two values were collected in the same way.
For an original fictional example, a weather exercise records a sustained value of sixty units and a brief gust of eighty. The gust does not automatically replace the sustained value in a classification that explicitly uses sustained wind. The example uses invented values and is not an official storm assessment.
This is a general measurement lesson. A short peak, an average and a maximum over a defined period can all be valid while answering different questions. Clear labels protect the reader from comparing numbers that look similar but represent incompatible summaries.
How do wind-speed units convert?
Miles per hour, kilometres per hour and knots are different units of speed. Convert the unit before comparing thresholds or observations, and retain the source's rounding. A number without a unit can look precise while remaining impossible to interpret correctly.
For an original arithmetic exercise, use one mile as 1.609344 kilometres. Seventy-four miles per hour is about 119.1 kilometres per hour. This demonstrates the relationship behind commonly rounded descriptions of hurricane strength; it is not a new local warning threshold or a forecast about a particular system.
Keep the original value in your calculation sheet and round only the displayed conversion. Repeatedly converting a rounded result back and forth can create small differences. Those differences should not be mistaken for a change in the actual measured weather.
Does a wind category describe every hazard?
No single wind category captures all the hazards associated with a tropical cyclone. NOAA's hazard information discusses storm surge, rainfall flooding, winds and other effects. A storm's location, size, movement and the local setting can matter as well. Do not treat a lower wind label as a general declaration that every location is safe.
For an original comparison, imagine two fictional systems with the same wind classification but different rainfall distributions and coastal settings. Their impacts need not be identical. The classification is useful within its defined purpose, while a full risk assessment needs additional information.
This article does not calculate local risk from a category or provide a substitute for official advice. The educational point is to read the whole relevant warning and its location-specific information rather than selecting one number and assuming it answers every safety question.

Historical research-aircraft illustration, not a photograph of a current hurricane flight.
What is storm surge?
NOAA defines storm surge as the storm-related rise in seawater above the expected astronomical tide. It explains that winds pushing water toward shore are a major cause, with the coastal shape, water depth and storm characteristics influencing the result. It is not simply another word for every wave seen during rough weather.
For a conceptual drawing, mark an expected tide level and a separate storm-related addition. Label both relative to the same reference. Do not place numbers on the diagram and present it as a real forecast unless they come from an appropriate official product for the location and time.
The drawing can help learners understand why two reports need compatible reference levels before their water heights are compared. A height above one datum and a height above another are not automatically the same quantity, even when both are expressed in metres.
How is storm tide different?
Storm tide is the total observed seawater level resulting from the astronomical tide together with the storm-related contribution, under the explanation supplied by NOAA. Keep the total and the additional component distinct. Otherwise a report can double-count the surge by adding it again to a value that already includes it.
Use an original simplified model with an expected tide of one metre and a fictional storm-related addition of two metres, measured against the same reference. The model's combined level is three metres. It is not a prediction, and it deliberately omits processes that a real coastal model may need to consider.
Ask students which number is the component and which is the total. This simple accounting exercise teaches a transferable skill: before adding quantities, check whether one already contains the other. The same issue appears in budgets, population tables and many scientific summaries.
Why does rainfall require its own information?
Wind strength does not directly supply a rainfall total for every place. Rainfall distribution and duration need their own observations or forecasts. A report about the centre of a storm is not enough to calculate how much water will fall at an arbitrary location, and a satellite cloud image does not automatically provide a measured ground total.
For an original arithmetic exercise, imagine a uniform ten millimetres of rain over one square metre. Since ten millimetres is 0.01 metres, the idealised volume is 0.01 cubic metres, or ten litres. This is a unit-conversion model, not a statement that every litre becomes runoff or enters a building.
Real runoff depends on additional conditions such as surfaces, drainage and terrain. The classroom calculation isolates rainfall depth and area. Explain the model's boundary rather than extending a correct volume calculation into an unsupported flood prediction.
What can a satellite image establish?
It can show features captured by a particular instrument at an identified time and under a stated image product. It is not a complete account of conditions at every ground location. Colour scales, enhancement methods and the part of the spectrum being displayed affect interpretation.
For an original image-reading task, give learners a fictional map with a legend, timestamp and highlighted area. Remove the legend and ask which interpretations become uncertain. Then restore it and distinguish an observation from a prediction. The exercise demonstrates why the surrounding labels are part of the evidence.
A historical storm image should retain its name and date in the caption. Reusing it as though it showed a current system can mislead readers, even when the photograph is genuine. Accurate provenance matters just as much for scientific imagery as for news photography.
How should a forecast map be read?
Start with the issuing organisation, update time, valid period, legend and geographic scope. A map can represent a forecast path, probability, rainfall or wind information; those are different products. Do not assume that every coloured shape describes the entire area of hazard or that a line represents a measured current position.
For an original classroom map, draw a fictional predicted route and a separate uncertainty area, then state exactly what each is intended to represent. The model should not be presented as an official forecast cone or assigned real-world probabilities without supporting methodology.
When a real situation is involved, use the current official product and its explanation. This static guide cannot tell a reader whether their home is inside a warning, whether a road is open or what action local authorities require at that moment.
Why do names differ by region?
Hurricane, typhoon and tropical cyclone can refer to the same broad kind of system under different regional naming conventions. NOAA's terminology material explains those distinctions. A storm in the Indian Ocean should not automatically be described using an Atlantic-specific label simply because an English-language headline uses hurricane elsewhere.
For an original geography exercise, label several ocean basins on a blank world map and connect each term to the appropriate regional context from an official reference. Keep the activity about terminology rather than assigning an unverified strength to an actual storm.
This helps Pakistan-based learners compare international reporting without confusing the language of one basin with a local warning system. The correct source for a real event depends on the affected region and the responsible meteorological and emergency authorities.
What should you remember?
Identify the storm type, region, unit and time before interpreting a headline. Warm water alone does not guarantee formation, a wind category does not describe every hazard and a historical satellite image is not a current forecast. Separate surge from total water level and observations from predictions.
Explore more science learning guides for related measurement exercises. The aim is not to diagnose a storm from a single number, but to understand what each scientific product measures and which questions require current, location-specific official information.
For related water-storage and measurement concepts, explore the groundwater guide.
Sources
- NOAA: What is a hurricane?, for the broad definition and strength context.
- NOAA: How hurricanes form, for interacting formation conditions.
- NOAA: Hurricane hazards, for the distinction between wind and other hazards.
- NOAA: Storm surge and storm tide, for water-level terminology.
- NOAA: tropical-cyclone terminology, for regional naming context. All numerical maps and classroom weather scenarios above are fictional models, not forecasts or local emergency instructions.
Image credits: cover: NASA MODIS Satellite Imagery, source, Public domain. Resized and converted to WebP. inline: obz3rv3r, source, CC BY 2.0. Resized and converted to WebP.
Found an error or an outdated detail? Report a correction with the article URL and original source.