
Kagiso Rabada Reaches 350 Test Wickets: Numbers Explained
Rabada’s 350th Test wicket came in South Africa’s Cape Town series win. Read the verified context and learn average, economy, strike rate and over notation.

Kagiso Rabada reached 350 Test wickets against Australia at Newlands on 31 October 2026, with Travis Head becoming the milestone dismissal. South Africa won the Cape Town Test by 176 runs and took the series 2–1, according to the ICC's completed-match report.
The milestone offers more than a large career number. It is also a useful opportunity to understand what bowling average, economy, strike rate and figures actually measure. This guide combines the verified match context with original arithmetic exercises, keeping current records separate from teaching examples.
What happened in the Cape Town decider?
The ICC reports that Rabada dismissed Matt Renshaw and Marnus Labuschagne in his first over on the final morning. Head later fell to a catch by Marco Jansen at gully, giving Rabada his 350th Test wicket. Simon Harmer's five-wicket contribution helped complete South Africa's win.
Australia had been set 288. The result completed South Africa's recovery from losing the first match of the series. These facts describe the completed game; they should not be confused with an earlier live score or a prediction written before the final day.
A useful match summary preserves both the individual milestone and the team outcome. Rabada's landmark is important, but a complete account should not imply that one bowler alone produced every wicket or the entire series victory.
Who is Kagiso Rabada?
Cricket Australia's official player record identifies him as Kagiso Shaquille Rabada, born 25 May 1995 in Johannesburg, with a right-arm pace bowling style and left-handed batting style. He is 31 on this article's check date, 1 November 2026.
The same record dates his T20I debut to 5 November 2014, ODI debut to 10 July 2015 and Test debut to 5 November 2015. It also notes his role in South Africa's 2014 Under-19 World Cup success, including 6/25 in the semi-final against Australia.
These dates give a verified outline of his development. They do not establish an explanation for every later selection, fitness decision or tactical role. Current availability should be checked against current team news rather than inferred from a career biography.
What did the checked Test statistics show?
The player page retrieved on 1 November 2026 listed 75 Tests and 350 wickets, with 7,740 runs conceded and a displayed bowling average of 22.11. These are dated page values, not a live counter that this article automatically updates after every future delivery.
| Measure | Checked value |
|---|---|
| Test matches | 75 |
| Test wickets | 350 |
| Runs conceded | 7,740 |
| Displayed bowling average | 22.11 |
Keep the format label attached to the figures. An ODI total and a Test total describe different datasets. A combined international count should not be presented as a Test count simply because both belong to the same player.
If you revisit the source later and see a changed total, check the update date and matches included. A difference between two snapshots is not automatically an error; the player may have appeared again or the source may have updated its record.
What does a bowling average measure?
Bowling average divides runs conceded by wickets taken. Using the checked Test figures, 7,740 divided by 350 is approximately 22.114, consistent with the displayed 22.11 to two decimal places. This is an arithmetic check of those inputs, not a new statistical source.
For a simpler fictional exercise, imagine a bowler conceding 180 runs while taking nine wickets. The average is 20 runs per wicket. A second fictional bowler conceding 120 runs for four wickets has an average of 30, despite conceding fewer runs in total.
The denominator matters. Comparing only runs conceded misses the wickets taken. Comparing only wickets misses the cost in runs. The average combines those two quantities, but it still does not describe every match condition or contribution.
If the fictional bowler has no wickets in the selected period, division by zero needs special handling. A worksheet or program should not quietly print an average of zero. Mark the situation clearly and explain what calculation cannot be performed.
How is economy different from average?
Economy expresses runs conceded per over. Average expresses runs conceded per wicket. They answer different questions, so two bowlers can look different depending on which measure you examine.
Use another fictional spell: 30 runs conceded in six completed overs, with two wickets. The economy is five runs per over, while the average for that spell is fifteen runs per wicket. The same performance produces two numbers because the denominators differ.
Suppose a second fictional spell also concedes 30 in six overs but takes one wicket. Its economy remains five, while its average becomes thirty. This shows why equal economy does not imply equal wicket-taking output.
Do not turn a short spell's average into a career judgement. A small sample can change sharply with one extra wicket or boundary. State the period and format before using a rate in a comparison.
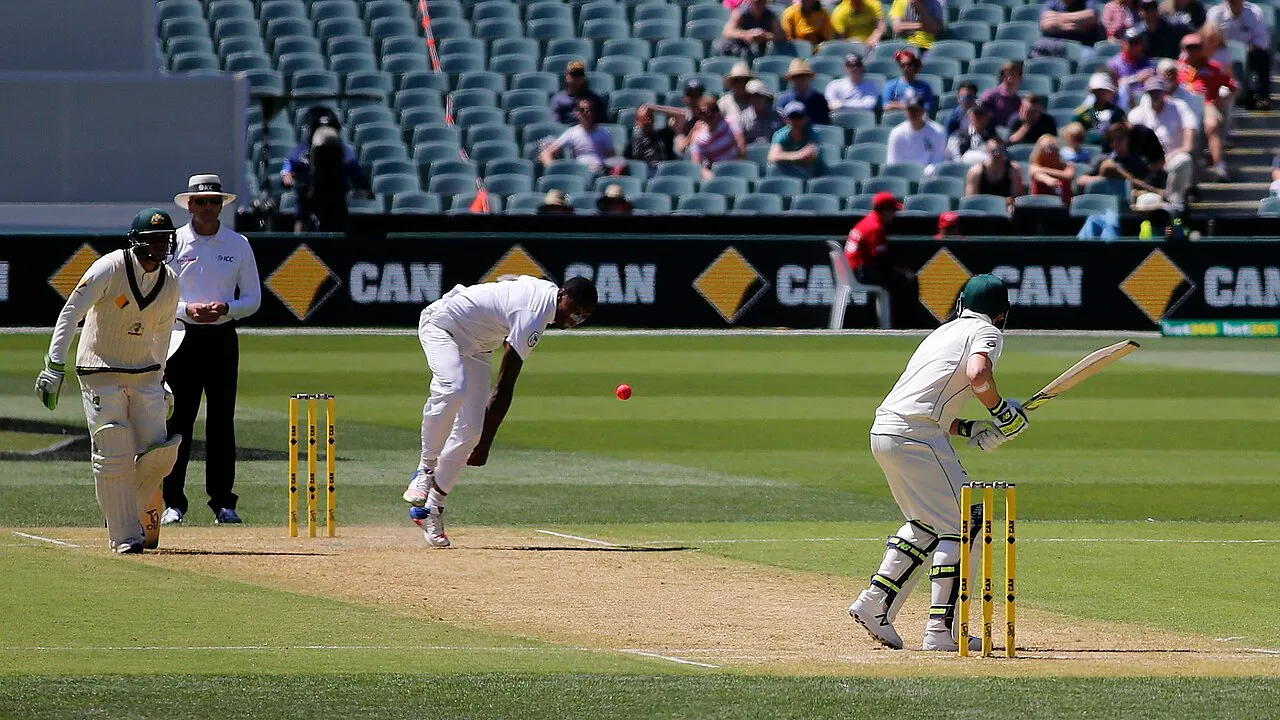
Rabada bowling to Steve Smith in a separately photographed match. This image is not identified as the 350th-wicket delivery.
What does bowling strike rate mean?
Bowling strike rate measures deliveries per wicket. It is different from batting strike rate, which measures runs per hundred balls. The word “strike rate” needs its batting or bowling context to be interpreted correctly.
In a fictional six-over spell containing 36 legal deliveries and two wickets, the bowling strike rate is eighteen balls per wicket. If the same number of deliveries produces one wicket, the figure is thirty-six. The example explains the calculation; it is not a claim about Rabada's particular spell at Newlands.
When reading a record headline, ask which measure is being compared. Fastest to a wicket milestone by matches, by deliveries and by elapsed time are different claims. A headline that omits the measure is incomplete evidence for a precise record comparison.
This article does not use an unverified “fastest ever” label for the new milestone. The verified claim is the 350th wicket and its match context. A broader record claim needs a checked comparison and a clearly stated denominator.
Why is an over written as 6.2 not a decimal number?
In conventional six-ball-over notation, 6.2 means six completed overs plus two legal deliveries. It does not mean 6.2 mathematical overs. Convert the notation to balls before using it in a calculation.
Six completed overs contain 36 legal balls, so 6.2 represents 38 legal deliveries. For a fictional spell conceding 38 runs in that period, the economy is six runs per six-ball over: 38 runs divided by 38 balls, multiplied by six.
Dividing 38 directly by 6.2 would give a misleading result because it treats the notation as a decimal fraction. The appearance of a decimal point does not make every field a decimal quantity.
This is a good programming exercise for learners. Split the completed-over and ball components, validate that the ball component is within the permitted range, convert to total legal deliveries and only then calculate the rate. Our Python lessons provide a place to practise the required variables and arithmetic.
What can a wicket sequence teach you about a spell?
List the dismissals in order and describe what is established by the scorecard or report. Then separate those facts from an interpretation of the bowling. A caught dismissal identifies the recorded outcome; it does not automatically tell you every detail of the intended plan.
If you have access to authorized footage, examine the deliveries around the wicket as well as the wicket ball. Ask whether you can see a change in line, length or field, and state when the broadcast does not show enough information to answer.
Avoid claiming a complete tactical explanation from one still image. A photograph can show a release position or a moment of play, but it cannot show the full sequence. This guide's images are identified by their source records, rather than used as proof of an unseen bowling plan.
How should students compare two bowlers fairly?
Begin with the question: are you comparing wicket-taking frequency, run control, longevity or a particular match performance? Choose statistics suited to that question and preserve the format and period.
For an original classroom task, create two fictional rows with runs, legal deliveries and wickets. Calculate average, economy and bowling strike rate separately. Explain why a bowler can lead on one measure without leading on all three.
Then add context you could not obtain from the arithmetic alone: conditions, opponents, role and sample size. These do not erase the numbers; they help you avoid asking the numbers to answer questions they were not designed to settle.
Our ICC rankings guide explains another distinction: a performance statistic is not itself an official ranking position. Check the appropriate table before claiming a ranking change.
Does a milestone settle every debate about a player?
No single total settles every question. Reaching 350 Test wickets establishes a significant career achievement. A discussion about the best spell, a current selection or a comparison across eras still requires a defined question and suitable evidence.
You can appreciate the achievement without inventing a prediction about the next landmark. A projection based on an assumed future wicket rate is a scenario, not an announced outcome. Injuries, selection and the schedule cannot be treated as known simply to produce a confident forecast.
For the same reason, a historical injury report should not be repeated as today's status. Use current team communication if the purpose is to determine availability for a forthcoming fixture.
What is the key takeaway from Rabada's 350th wicket?
The verified story is a personal landmark within South Africa's series-clinching Cape Town win. The learning opportunity is to read the supporting numbers precisely: wickets are a count, average uses wickets as the denominator, economy uses overs and bowling strike rate uses deliveries.
Keeping those definitions separate makes a match report more informative and a comparison more honest. It also lets students practise useful arithmetic through a sporting event without pretending that a classroom formula captures every aspect of fast bowling.
Sources
Source 1: completed Cape Town Test report
Source 2: official player biography and statistics
Checked 1 November 2026. Career figures are a dated snapshot. All explicitly fictional spells are original teaching examples, not additional claims about Rabada's match figures.
Image credits: cover: EGilham, source, CC BY-SA 4.0. Resized and converted to WebP. inline: www.davidmolloyphotography.com, source, CC BY 2.0. Resized and converted to WebP.
Found an error or an outdated detail? Report a correction with the article URL and original source.