
OGDC September 2026 Results: Revenue, Profit and EPS Explained
Read OGDCL's September-quarter figures with the right units, distinguish profit from cash and understand the dividend percentage without confusing it with a return.
Oil and Gas Development Company Limited, commonly searched as OGDCL or OGDC, is an exploration and production company in Pakistan. Its quarterly results are easier to understand when the reporting period and units are read before the largest number. Revenue, profit, earnings per share and a declared dividend describe different things; they should not be presented as interchangeable measures of cash received by an investor.
This guide explains the company's September 2026 quarterly filing through a few verified figures and original calculations. It is financial-statement education, not a buy recommendation, price target or promise about future returns.
What does Oil and Gas Development Company do?
The Pakistan Stock Exchange profile describes the company's business as exploring and developing oil and gas resources, including production and sale. It records incorporation on 23 October 1997 and traces the earlier corporation to 1961. The company profile also presents its activity within the exploration and production sector.
That business description is a better starting point than assuming every oil-related company performs the same job. Finding and producing hydrocarbons, refining petroleum and selling fuel to motorists are different activities. A headline about an exploration company is not automatically a notice changing the retail pump price.
For a student project, draw a simple chain with separate boxes for exploration, development, production, processing and distribution. Use it as a general industry learning aid, not a claim that one company owns every box or every asset along the chain.
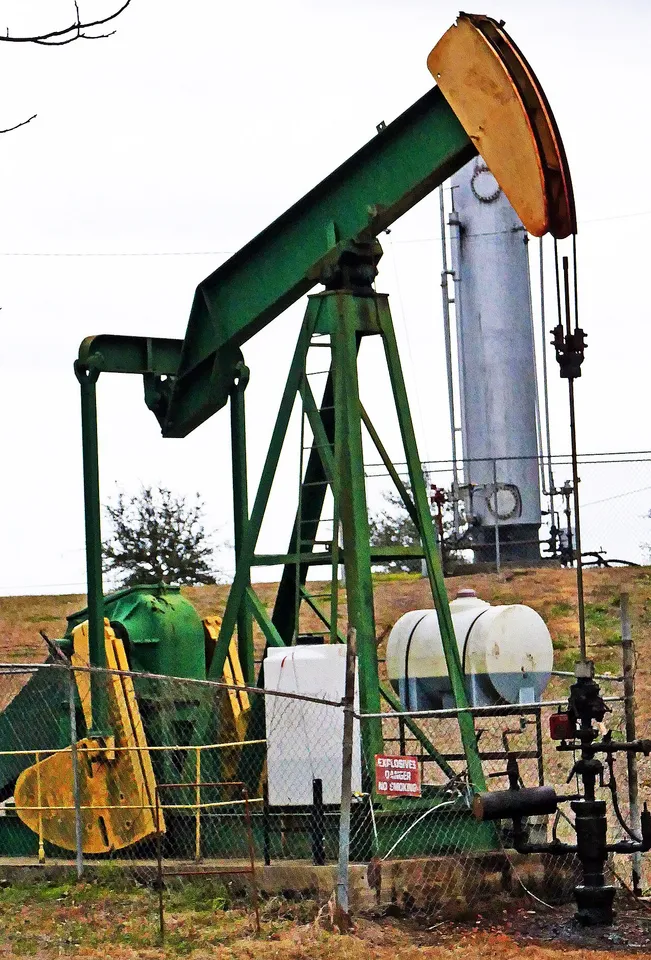
The photographs on this page illustrate oil-production and gas-processing equipment outside Pakistan. Their captions identify the locations. They are not being presented as OGDCL installations or photographic evidence of a new company discovery.
Which quarterly results are being discussed?
The filing dated 30 October 2026 concerns the quarter ended 30 September 2026. Its profit-or-loss statement is marked unaudited and compares that quarter with the quarter ended 30 September 2025. That is a same-quarter year-on-year comparison, not a comparison of a single quarter with a whole financial year.
| Item | Quarter ended 30 September 2026 | Comparable 2025 quarter |
|---|---|---|
| Revenue, approximately PKR billion | 132.419 | 96.192 |
| Profit for the quarter, approximately PKR billion | 58.513 | 38.305 |
| Basic and diluted EPS, PKR per share | 13.60 | 8.91 |
The first two rows have been converted from the filing's rupees-in-thousands presentation and rounded to three decimal places. EPS retains its own rupees-per-share unit. The official filing remains the reference for the full statement, notes and unrounded figures.
Do not silently relabel an unaudited interim statement as an audited annual result. Both the period and the status are part of the record. A financial table loses meaning when those labels are dropped to make a headline shorter.
How do you convert rupees in thousands into billions?
The statement's revenue entry is 132,418,817 under a rupees-in-thousands heading. Each displayed unit represents one thousand rupees. To express the same value in billions of rupees, divide the displayed number by one million, giving 132.418817 billion, or approximately 132.419 billion after rounding.
The conversion can feel counterintuitive because the heading has already removed three zeroes. You are not starting with a plain-rupee figure. Multiplying or dividing by a thousand without first reading that heading can create a result that is a thousand times too large or too small.
Practise with a fictional table entry of 2,500,000 in rupees thousands. Its plain-rupee value is 2.5 billion. Write the unit beside every stage rather than keeping only the digits. The written unit tells the next reader why the transformation is correct.
EPS is the important exception in this example. It is already expressed in rupees per share, so it should not be divided by one million along with the revenue column. A spreadsheet routine that applies one conversion to every numeric field can therefore produce a tidy but misleading table.
What is the year-on-year revenue change?
Using the filing's unrounded values, revenue increased by approximately 37.66% relative to the comparable quarter. The calculation subtracts the old value from the new value, divides by the old value and multiplies by 100. The denominator is the earlier quarter, not the new one.
The profit comparison calculated in the same way is approximately 52.76%. These are calculations from the reported figures, not management forecasts. They describe the selected historical comparison and do not establish that the same growth will occur next quarter.
For a fictional exercise, revenue rises from 80 to 100. The increase is 20, and the growth rate is 25% because 20 is divided by 80. Dividing by 100 instead produces 20%, which answers a different question about the increase relative to the new value.
Keep rounded display values separate from calculation inputs. If you calculate with heavily rounded billions, the final percentage can differ slightly from one calculated with the full table entries. That does not automatically indicate an error, but the method should be clear.
Does higher revenue prove higher production?
Revenue is a money measure. Production is an operational measure with its own physical units. A revenue change alone does not isolate how much came from output, realised prices, product mix or other relevant factors. To explain the cause, examine the operational information and management discussion rather than infer it from the headline total.
Consider a fictional business selling 1,000 units at 100 rupees each. Revenue is 100,000 rupees. If it later sells 1,100 units at 90 rupees each, volume rises by 10% while revenue falls to 99,000 rupees. Output and revenue have moved in different directions.
The example is arithmetic, not a claim about OGDCL's actual product prices or production. It shows why a single financial line cannot answer every operational question. A careful article distinguishes the measured result from an explanation that would require additional evidence.
The same discipline applies to an announcement about a field. A discovery, the start of production and a sustained production rate are different statements. Read what the actual notice confirms instead of treating every positive-sounding operational title as a complete long-term output forecast.
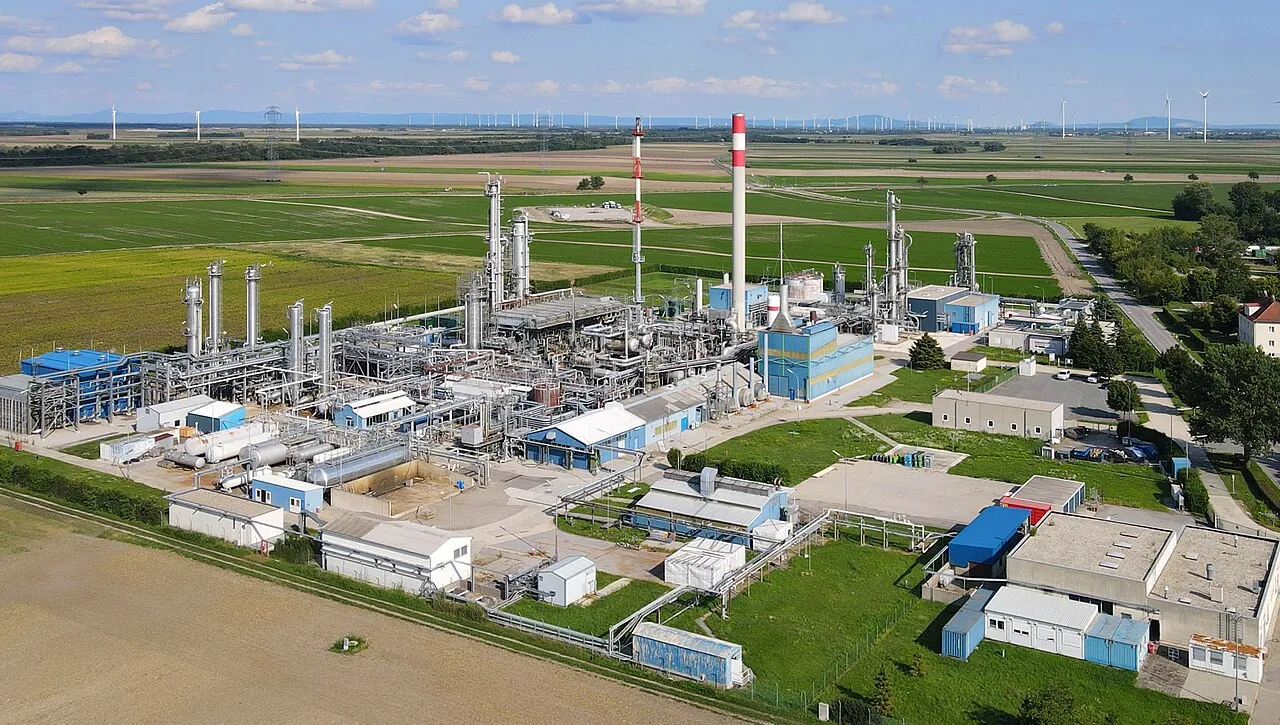
Natural gas processing equipment in Aderklaa, Austria. The installation illustrates industrial context and is not identified as an OGDCL facility.
Profit is not the same as cash collected
An income statement and a cash-flow statement serve different purposes. The SEC's beginner guide explains that an income statement describes earnings and expenses over a period, while a cash-flow statement reports cash movements. They are related records, but a profit figure is not simply the period's cash balance.
For a student, use a fictional sale on credit. A business may have a recorded sale while the customer has not yet paid the invoice. That example illustrates why you should not rename revenue "cash received" without checking the relevant accounting and collection information.
A complete review would look at the financial position, cash flows and notes alongside the profit-or-loss statement. This article does not invent a collection figure or diagnose a particular receivable from the selected revenue and profit rows.
Create separate notebook headings for revenue, profit, operating cash flow and cash balance. If you have not checked a field, leave it explicitly unchecked. Entering the profit number into all four boxes would not make the review more complete; it would erase the distinctions you need to understand.
What does the declared PKR 5 dividend mean?
The October filing announces an interim cash dividend of PKR 5 per share and describes it as 50%. The PSX profile gives a face value of PKR 10. In that context, five rupees is half the face value; the percentage is not a promise of a 50% return on whatever market price a person pays.
Keep declaration, entitlement and actual payment distinct. The company's notice contains the relevant register and book-closure instructions. This guide does not determine a particular person's eligibility or replace those instructions with an inferred trading deadline.
A fictional example makes the percentage distinction clear. If a five-rupee distribution is compared with a hypothetical 200-rupee purchase price, the simple ratio is 2.5%. That calculation is not the same denominator as five divided by a ten-rupee face value. Neither calculation alone measures a complete investment return.
Price changes, timing and applicable costs can affect a real outcome. The useful lesson here is narrower: always identify the denominator behind a financial percentage. Do not copy the largest percentage on a notice into a personal-return claim.
Why not multiply the quarter by four and call it next year's profit?
Multiplying a historical quarter by four produces a simple annualised arithmetic figure. It does not establish what will actually happen across four future quarters. The operation assumes a repetition that has not been proved by the multiplication itself.
For a fictional business, one quarter may contain an unusual sale or expense. A model can explore an assumption about repetition, but its output should remain labelled as a scenario. Presenting the result as an announced annual forecast would change the status of the information.
This distinction is useful in school spreadsheets. Put the assumption in a separate cell and label the output "scenario," not "reported result." That design lets another reader see which numbers came from a source and which came from a model you created.
It is equally important when comparing an annual summary with a new quarterly announcement. Match the periods before calculating a growth rate. A longer period normally covers more activity, so a bigger number alone does not establish a stronger performance.
Make a source-first financial worksheet
Use columns for entity, reporting period, statement type, audit status, item, original value, original unit, converted value and source. Keep the original number even after conversion so a reviewer can trace your arithmetic back to the filing.
Add a formula description rather than relying on an unexplained spreadsheet result. For growth, identify the earlier-period denominator. For margin, identify which profit measure is being divided by which revenue measure. Do not mix gross profit with a profit-after-tax label.
From the selected quarter's profit and revenue, the simple ratio is approximately 44.19%. Label it as profit for the quarter divided by revenue, rather than an operating margin. An operating-profit calculation would require the appropriate operating-profit measure and its definition.
For programming practice, use fictional values before substituting a verified dataset:
def growth_percent(current, previous):
    if previous <= 0:
        raise ValueError('This simple growth example needs a positive base')
    return (current - previous) / previous * 100

print(growth_percent(100, 80))  # Fictional example: 25.0
The check prevents an unsuitable denominator from being hidden inside a plausible-looking result. It does not make the program a complete financial-analysis service. The definitions, source and period still need to be correct before the arithmetic becomes meaningful.
Students can practise those functions through our programming courses. For a related energy-sector distinction, our refinery costs and petrol-price guide separates a cost change from a retail price conclusion. Both topics require careful labels rather than automatic cause-and-effect claims.
Common questions about OGDC and the results
Are OGDC and OGDCL references to different companies here?
In this guide, OGDC is the PSX symbol and a commonly used company reference, while OGDCL abbreviates Oil and Gas Development Company Limited. Confirm the entity through the official profile rather than assuming every similar abbreviation belongs to the same business.
Is EPS the dividend amount?
No. Earnings per share and a declared dividend are different measures. A profit calculation does not automatically become a distribution to shareholders. Read the declaration separately and keep its unit and conditions intact.
Does this page give a live share price?
No. A market quote needs its own session and timestamp. The financial figures discussed here belong to a specified reporting period; they should not be confused with a live trading screen or a recommendation about a transaction.
Are the equipment photographs OGDCL assets?
No. They are labelled illustrations from Mississippi and Austria. They explain the general production and processing context without claiming the pictured installations belong to the company.
Sources
- OGDCL quarterly financial-results filing, 30 October 2026
- PSX company profile and announcements
- Official company profile
- SEC beginner guide to financial statements
Image credits: cover: Calstanhope, source, CC BY-SA 4.0. Resized and converted to WebP. inline: C.Stadler/Bwag, source, CC BY-SA 4.0. Resized and converted to WebP.
Found an error or an outdated detail? Report a correction with the article URL and original source.